Search This Blog

Tuesday, 20 December 2016

New in OpenWebGIS 2, December 2016

OpenWebGIS version 2 is an open source web-browser based Geographic information system (GIS). OpenWebGIS 2 continues to develop. As has been announced now the second version of OpenWebGIS is created based on OpenLayers 3 (OL3). Version 1 of OpenWebGIS (old interface system, new interface system) uses OpenLayer 2 (OL2). Thus the code base of OL2 and OL3 is totally different (new event handlers, etc). so migration pretty much means full rewriting of source code, so the work moves slowly. The main purpose of OpenWebGIS 2 is the transformation of this GIS on the modern software basis for modern browsers and mobile devices with touch screens, to increase speed, fix issues of the previous version and create new opportunities for users. At this stage OpenWebGIS 2 is an editor for adding, styling and exporting of vector layers in various formats. The main menu in the expanded view is shown in Figure 1.
Figure 1 - The main menu of OpenWebGIS 2
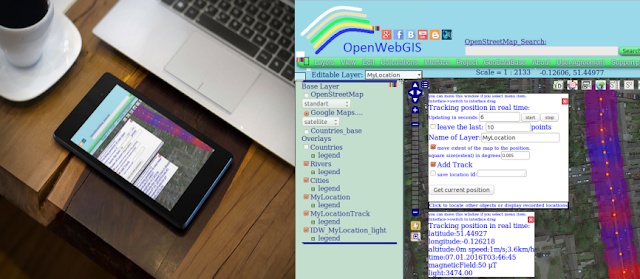
There is a geolocation feature through which you can get your positions in the form of a set of points, there are problems with the tracks drawing that will be solved soon. Also there may be some possible problems with getting geolocations in the latest versions of browsers (Geolocation API Removed from Unsecured Origins in Chrome 50).
The source code of OpenWebGIS 2 you can get on GitHub. Source code of version 1 OpenWebGIS you can get on GitHub and also version for Android (source code for Android and APK file for Android OS).
You can find detailed information about OpenWebGIS features and applications on our blog and at the opensource.com.
The OpenWebGIS blog and a full list of articles about OpenWebGIS provide a lot of information about possibilities and specific features of OpenWebGIS.

Tuesday, 15 November 2016

OpenWebGIS is working again


OpenWebGIS is running again after moving and a long period of non-working and you can use this free and open, browser based geographic information system (GIS) at the usual link.
Besides earlier announced plans on system developing (read about it also at Digital-geography.com and Geoawesomeness.com) OpenWebGIS team sets the new goal to explore the possibility to use the new library version of OpenLayers 3 (now in the core of the system OpenLayers 2 is used). The result of the first experiments is available at the link ( it will be updated, please follow the changes). This experimental version we will call OpenWebGIS 2. While the version OpenWebGIS 1.0 still is the main, actual and constantly supported. This OpenWebGIS 1.0 version should be used for your  diverse tasks in cartography.
Last month OpenWebGIS was working in the test mode, now it is fully functioning, but there are still some small technical problems - sometimes the system can be online unavailable.  In this case you should wait for a while and everything will be alright. You can use source code OpenWebGIS for your  projects. Copy and use it, it is possible to use the OpenWebGIS without having to connect to the server of OpenWebGIS and even without Internet connection. For doing this just download OpenWebGIS source code from GitHub or version for Android (source code for Android and APK file for Android OS). OpenWebGIS has new version of the interface. It is activated when you click on the «New Interface» button.
The OpenWebGIS team sincerely thanks everyone who uses our system, supports us, helps with their advice, and publishes information about OpenWebGIS. We hope to continue cooperation.
You can find detailed information about OpenWebGIS features and applications on our blog and at the opensource.com.
The OpenWebGIS blog and a full list of articles about OpenWebGIS provide a lot of information about possibilities and specific features of OpenWebGIS.

Thursday, 4 August 2016

Attention to all users of geographical information system OpenWebGIS


The OpenWebGIS server is physically moving to another location.
Besides the system will perhaps get another domain name and (or) it will use the web hosting service. Or for the users perhaps everything will remain as it was before.
But in any case for some time OpenWebGIS at the link http://opengis.dlinkddns.com will be unavailable.
It is not known how much time it will take to solve all these questions. It will be announced later.
But you can always (any time) and without limitations use OpenWebGIS local version, which is available for downloading from GitHub https://github.com/openwebgisystem/OpenWebGIS.
We apologize for any inconvenience caused to our users. 
The OpenWebGIS team sincerely thanks everyone who uses our system, supports us, helps with their advice, and publishes information about OpenWebGIS. We hope to continue cooperation.
You can find detailed information about OpenWebGIS features and applications on our blog (http://openwebgisystem.blogspot.com) and at the opensource.com (https://opensource.com/life/16/3/openwebgis)

Sunday, 24 July 2016

Import/Export of map layers from CSV file with WKT geometry in OpenWebGIS and QGIS


Almost in every Geographic information system (GIS) there is an opportunity to create maps (vector map layers) from files in CSV format. So CSV (Comma-separated values) file stores tabular data, that looks like numbers and text, in plain text. Each line of the file is a data record. Each record consists of one or more fields, separated by commas. In addition, the term "CSV" also denotes some closely related delimiter-separated formats that use different field delimiters. It is easy to add the data from such a file on a map, when it contains the information only about points and their attributes. In this case one field contains the longitude of the point, and in another field there is the latitude of the point.
For example the file with the information about the major world cities looks like this:

longitude,latitude,NAME,COUNTRY,POPULATION,CAPITAL
33.08604049999976,68.96354674999974,Murmansk,Russia,468000,N
40.646160130000375,64.52066803000004,Arkhangelsk,Russia,416000,N
30.453327180000375,59.95188904000009,Saint Petersburg,Russia,5825000,N
150.78001403999605,59.57099915000014,Magadan,Russia,152000,N
120.23000336000206,23.170000080000083,Tai-nan,Taiwan,656927,N
60.610130310000386,56.84654235999987,Yekaterinburg,Russia,1620000,N
43.9406700100003,56.28967667000006,Nizhniy Novgorod,Russia,2025000,N
-4.269947530000034,55.86280822999996,Glasgow,UK,1800000,N
120.23000336000206,23.170000080000083,Tai-nan,Taiwan,656927,N
61.39261246000016,55.14500045999982,Chelyabinsk,Russia,1325000,N
73.25028992000036,55.063304900000205,Omsk,Russia,1175000,N
82.94284821000016,55.03210067999992,Novosibirsk,Russia,1600000,N
56.09612655999974,54.82173537999994,Ufa,Russia,1100000,N
25.275966640000274,54.688568120000184,Vilnius,Lithuania,582000,Y
….
So according to the rules of every particular GIS, it is necessary to specify which fields are the fields with coordinates, then press "OK" button and here we get the map. We will tell how to do it with the help of QGIS and OpenWebGIS - Free and Open Source Geographic Information Systems.
In OpenWebGIS it is done as shown in Figure 1 and 2. To do it - you can select menu item "Layer->New point Layer from csv file". First it is necessary to select CSV file with the help of "Browse" button, then fields with longitude and latitude.
Figure 1 - Adding CSV file on the OpenWebGIS map

Sunday, 3 July 2016

One of the methods to create and use offline base maps for web based GIS, JavaScript example


In order to create a base map for web based and browser Geographic information system (GIS), which can be used in offline mode (i.e., when there is no Internet connectivity), the following methods may be used:

Sunday, 17 April 2016

Earthquake in Ecuador on 17 April 2016 - foreshocks, mainshock and aftershocks


Initial data on earthquake was selected from the database of "Earthquake Archive Search" with the help of menu item in OpenWebGIS: "GeoDataBase-> Earthquakes Database".
For the analysis we choose a rectangle with coordinates:
lower left longitude: -89.53593749261435; lower left latitude: -6.373536989337675; upper right longitude: -72.44121093249441; upper right latitude: 5.382686176012323.
Magnitude range: from 2 to 10.
Date & Time(UTC): from 2016-03-01T00:00:00 to 2016-04-17T10:39:04.

The result of selecting, adding on the map and customizing the legend is shown on Figure 1.
Figure 1 - The earthquake in Ecuador on 17 April 2016: the result of selecting, adding on the map and customizing the legend in OpenWebGIS

Sunday, 20 March 2016

Mapping information from Paleobiology and Global Biodiversity databases in OpenWebGIS


This article tells about working with Databases Paleobiology Database (PaleoBioDB) and The Global Biodiversity Information Facility (GBIF) using an open source Geographic information system OpenWebGIS. This is a brief description of the databases (DBs) from these projects websites:
«The Paleobiology Database (PaleoBioDB) is a non-governmental, non-profit public resource for paleontological data. It has been organized and operated by a multi-disciplinary, multi-institutional, international group of paleobiological researchers. Its purpose is to provide global, collection-based occurrence and taxonomic data for organisms of all geological ages, as well data services to allow easy access to data for independent development of analytical tools, visualization software, and applications of all types. The Database’s broader goal is to encourage and enable data-driven collaborative efforts that address large-scale paleobiological questions.» 

«The Global Biodiversity Information Facility (GBIF) is an international open data infrastructure, funded by governments. It allows anyone, anywhere to access data about all types of life on Earth, shared across national boundaries via the Internet. By encouraging and helping institutions to publish data according to common standards, GBIF enables research not possible before, and informs better decisions to conserve and sustainably use the biological resources of the planet. GBIF operates through a network of nodes, coordinating the biodiversity information facilities of Participant countries and organizations, collaborating with each other and the Secretariat to share skills, experiences and technical capacity.
GBIF's vision: "A world in which biodiversity information is freely and universally available for science, society and a sustainable future."»

The data selecting from these DBs and mapping the results using OpenWebGIS was discussed in the following articles: "The information tools (data base and GIS) to help paleontologists in their scientific researches", "New feature of OpenWebGIS - mapping data from GBIF, and new Contributor".  From the article "200 million years of the dinosaurs life (sauropods) in a few seconds on the map" the following conclusion can be made, that in OpenWebGIS it is possible not only to visualize on the map data from these databases but also analyze it without using other software.

Currenlly OpenWebGIS team continues to optimize and increase the convenience to users of selecting and mapping this information. Previously only few fields were sampled from the Paleobiology Database, but now all fields are selected (See Figure 1). 
Figure 1 - Selection option from Paleobiology Database, result of mapping and attribute table of the result layer
In the resulting attribute table of layer from GBIF there are now photos of species (See Figure 2).
Figure 2 - Selection option from Global Biodiversity Information Facility, result of mapping and attribute table of the result layer

The sampling process has become more flexible (e.g. it is not necessary to insert the scientific name of species). Using the peculiar features (they use CORS technology) of these DBs, now in OpenWebGIS you have an opportunity to work with them, not only in the online (web) version but also in the local version and Android OpenWebGIS (of course in case your Internet connection is alive). 
OpenWebGIS team would like to express our clear positive attitude to these databases. They make it possible to select and work with information that is interesting for professionals, scientists and for a wide range of people. Perhaps many of you will be excited by the touch of real and understandable information about the biological past and present of our world. We urge all to use these databases and help them in their development and contributing data.

From the programmers' point of view, PaleoBioDB and GBIF have a very convenient, simple and easy-to-use application programming interface (API). Please see information about PaleoBioDB API and GBIF API.

We would like to thank PaleoBioDB and GBIF teams. We appreciate their efforts and we are grateful to the creators and participants of these projects.
We would like also to mention some new updates in OpenWebGIS. In Android version the opportunity has recently appeared to test the new interface and now it is more convenient to use attribute tables (its size is adaptive now) of the layers.

We remind that the last new version app for your mobile devices is always available for downloading at itch.io and at Google Drive. But as a rule there are some older versions at mobango.com, aptoide.com, getjar.com. OpenWebGIS app is not published at Google Play so far, but we are planning to do it.
The OpenWebGIS blog and a full list of articles about OpenWebGIS provide a lot of information about possibilities and specific features of OpenWebGIS.


Yours sincerely, OpenWebGIS team.

Sunday, 13 March 2016

Customizing of OpenWebGIS interface to create your own workspace


Working in OpenWebGIS now you can create your own workspace by adding images, videos, texts, websites on the page, changing the color, size and position of the interface blocks. Then you can save your workspace on OpenWebGIS server, in the local storage of your browser or in text file for further use at any time convenient for you. So you will always have at your fingertips in one place the Geographic information system (GIS) and your any additional information from any source in the form of videos, images and websites. This can greatly improve your efficiency.
Earlier in the articles "New and old interface of OpenWebGIS" (January 2015), "Developing the new interface design of OpenWebGIS" (February 2016) and some others it was told about OpenWebGIS interface features and how it can be customized by the user. In this article, we suggest you to consider one more possibility to change the interface and adjust it to your needs. This feature already exists for some time, but it has not been told about it in detail, moreover, it has been redesigned and improved recently. 

Thursday, 10 March 2016

New feature of OpenWebGIS - mapping data from GBIF, and new Contributors


OpenWebGIS team has started developing the new feature. You, our users and contributors inspire us on constant improvement of OpenWebGIS. Thanks to our new contributors info from Canada and ANDREA ANSELMI from Italy. Now you can use selecting and mapping data from The Global Biodiversity Information Facility (GBIF). GBIF is an international open data infrastructure, funded by governments. «The data accessible through GBIF relate to evidence about more than 1.6 million species, collected over three centuries of natural history exploration and including current observations from citizen scientists, researchers and automated monitoring programmes». More about GBIF read here. You can make your selections and put them automatically on the map using the menu item of OpenWebGIS "GeoDataBase-> Global Biodiversity". After that a popup (see Figure 1, 2) window will appear with options for your query.
Figure 1 - Popup window for GBIF in the old interface of OpenWebGIS
Figure 2 - Popup window for GBIF in one of variants of a new interface of OpenWebGIS
Insert the scientific name of the species. Please write this name like it is described in GBIF Backbone Taxonomy. Option "limit" -controls the number of results. The more the limit is — the selection and mapping are slower. Уou can specify a geographic Region like a rectangle based on coordinates: lower left longitude, lower left latitude and upper right longitude, upper right latitude. You can insert it by clicking on the map or typing manually. Coordinates are inserted after clicking on the map if this value is equal to zero or empty.

The example of mapping result you can see on Figure 3.
 
Figure 3 - The mapping result of data from GBIF
It is only the beginning and we will add the new options for sampling and mapping. Of course there are many sites and programs with which you can select data from GBIF, but may be it is better for you to do it with the help of OpenWebGIS - because you can set your own data style on the map and your base layers, use analytic functions for working with data and exporting it to other formats, and more.

Please support the crowdfunding campaign of OpenWebGIS and repost this information among your friends.

Read more information about crowdfunding campaign and our plans on Digital-geography.com, Geoawesomeness.com and Indiegogo.
Best regards, OpenWebGIS team.

Wednesday, 9 March 2016

Thanks to our Contributors, join them, support an open source project OpenWebGIS!


The crowdfunding campaign of OpenWebGIS on Indiegogo is continuing and today the new contributor Robertsonhl from Australia has supported this open source project. We would like to express our appreciation and this name will be on our site of OpenWebGIS.
Follow us on Facebook, Facebook group for interesting news in the field of GIS and Geospatial industry, on the Twitter, Google+, Tumblr.

OpenWebGIS is an open source online/offline geographic information system for work in web browser or mobile app. Since its foundation (2014), a great number of users have benefited from using this system functions. The site and the blog have been visited tens of thousands of times. Over this time the system was worth mentioning in respectable professional information resources.

Now OpenWebGIS needs funds for a qualitative leap in its development!
This system has been and will always be free and open, but the time has come when your support is needed in the form of financial assistance, in order that the system would continue to exist, evolve and help you in your work and life with new useful features. By means of funding you give thanks for the work on the creation of the existing functions and help in the creation of new ones. Share our plans and be part of the process! Be involved with other users who believe in us and share our vision!

Please support the crowdfunding campaign of OpenWebGIS and repost this information among your friends.

Read more information about crowdfunding campaign and our plans on Digital-geography.com, Geoawesomeness.com and Indiegogo.

Yours sincerely,
OpenWebGIS team.

Monday, 29 February 2016

Developing the new interface design of OpenWebGIS


OpenWebGIS team has started developing the new interface design. We offer you to consider a new version of the interface. It is activated when you click on the «New Interface» button (see Figure 1).
Figure 1- Click on the «New Interface» button to activate the new interface
Now the main menu, layers list, the search line on OpenStreetMap, Wikipedia can be hidden and open only when the user clicks. The map covers the entire screen (see Figure 2, 3).
Figure 2 - New interface of OpenWebGIS
Figure 3 - New interface of OpenWebGIS
Being in the new interface, you can return to the old one if you select the menu item «Interface->Set default interface» (see Figure 4).
Figure 4 - Set default interface

But you need to bear in mind that even without this option («New Interface») you have already had the opportunity to customize Interface for a long time - further information is given in this video:
 

What do you think about the new interface of OpenWebGIS?
  1. You like the new version of the interface, and it should be left;
  2. You like the new interface, but still there is need to continue developing it;
  3. You do not like the new interface and you need to keep the old one;
  4. You don't like either the new or the old interfaces, there is need to do something else;
  5. Other.

Please support the crowdfunding campaign of OpenWebGIS and repost this information among your friends.
Read more information about crowdfunding campaign and our plans on Digital-geography and Indiegogo.
The OpenWebGIS blog and full list of articles about OpenWebGIS provide a lot of information about possibilities of OpenWebGIS.

Sunday, 28 February 2016

Support OpenWebGIS crowdfunding campaign


OpenWebGIS is an open source online/offline geographic information system for work in web browser or mobile app. Since its foundation (2014), a great number of users have benefited from using this system functions. The site and the blog have been visited tens of thousands of times. Over this time the system was worth mentioning in respectable professional information resources.

Now OpenWebGIS needs funds for a qualitative leap in its development!
This system has been and will always be free and open, but the time has come when your support is needed in the form of financial assistance, in order that the system would continue to exist, evolve and help you in your work and life with new useful features. By means of funding you give thanks for the work on the creation of the existing functions and help in the creation of new ones. Share our plans and be part of the process! Be involved with other users who believe in us and share our vision!
Please support the crowdfunding campaign of OpenWebGIS and repost this information among your friends.
Read more information about crowdfunding campaign and our plans on Digital-geography.comGeoawesomeness.com and Indiegogo.
Yours sincerely,
OpenWebGIS team.

Tuesday, 16 February 2016

3D View enhancements in OpenWebGIS


In OpenWebGIS users can create not only a flat map (2D), but also 3D maps. To do this, OpenWebGIS uses Cesium JavaScript library. The article "3D maps, new version of Cesium JavaScript library and OpenWebGIS" tells about this in detail. On the first of February 2016 the new Cesium Version 1.18 was released:

"Here are the highlights of the new release:
  • Reduced the amount of CPU memory used by terrain by ~25% in Chrome.
  • Added a Sandcastle example to “star burst” overlapping billboards and labels.
  • Added VRButton which is a simple, single-button widget that toggles VR mode. Cardboard for mobile is supported. More VR devices will be supported when the WebVR API is more stable.
For more details and the full list of changes, see the changelog.”

To improve the efficiency of work with maps for users of OpenWebGIS the decision was made to migrate to this new version of Cesium. A lot of work has been done to correct the source code for the new version of Cesium and besides several problems were fixed that the users previously encountered while visualizing 3D maps.

In order to create the 3D map you must click on the button : 
in the upper right corner of the map. This button has the title "Add 3d Map. Globe ". There will be a pop-up window in which you can set the desired size of the 3D map area in pixels (see Figure1).
Figure 1 - 2D and 3D maps in OpenWebGIS

The source code of OpenWebGIS local (offline) can be downloaded from GitHub here
The source code of OpenWebGIS for OS Android can be downloaded from GitHub here.
Ready to use Android apk file (new version 1.016) for your mobile devices is available for downloading at itch.io , at Google Drive and also from GitHub from this link.
The OpenWebGIS blog and full list of articles about OpenWebGIS provide a lot of information about possibilities of OpenWebGIS.
Please test and report bugs or suggestions for improvement.

Sunday, 17 January 2016

Creating WiFi map and monitoring access points based on geographic information system (OpenWebGIS)


Maybe you want to create for yourself the WiFi map of the place you have visited, or maybe you want to collect and monitor parameters of WiFi-points? Do you want to create a map legend, mathematically analyze the information about a detected access point, export this data to popular Geographic information system (GIS) formats (gml, kml, geoJSON, osm, gpx or csv)?

«Wi-Fi (or WiFi) is a local area wireless computer networking technology that allows electronic devices to connect to the network, mainly using the 2.4 gigahertz (12 cm) UHF and 5 gigahertz (6 cm) SHF ISM radio bands»
In order to use the WiFi access point (or hotspot) it is necessary to know the geographic location of this point and its parameters (properties), for example, such as network name, authentication, key management, and encryption schemes, frequency, signal level, etc.

Friday, 8 January 2016

Use maps and sensors in your phone as one tool with the help of OpenWebGIS


Now, many phones, smartphones, tablets and so on (your mobile devices) have accelerometers, gyroscopes, magnetic field sensors, light (illumination) sensors, pressure sensors, etc. Data from these sensors is used in various applications for Android (hereinafter, it will be written about the use of sensors in the operating system Android). For different purposes, it may be useful not only to get (detect the parameters changes) the sensor output at any time, but to collect them during a large period of time with the reference to the space (map). For example it will be interesting to measure the illumination of the night streets in your city block, then interpolate these data and mathematically determine places where it is necessary to add a street lamp, or identify places where there is more magnetic field strength. It may be interesting to follow the direction change of your phone in space and in time according to cardinal points or follow your phone rotation angles according to the axes (x, y, z), for example so you can determine the moments when the phone is next to your ear during a call.

You can collect sensor data and refer them to the geographical coordinates in OpenWebGIS. To do this, first turn on geolocation of your device . Then you need to run on your device OpenWebGIS version for Android, after that select in the first window - local version (see Figure 1).