Search This Blog

Saturday 5 December 2015

Mathematical operations in OpenWebGIS (on the attributes of map layers)


In the description of geographic information system OpenWebGIS there is often a phrase:
"In OpenWebGIS you can use the extensive mathematical functionality to calculate and analyze your data." 
It is written because OpenWebGIS has a large set of such functions, among them there are geomathematics functions and mathematical operations on the attributes of map layers. OpenWebGIS (only in the online version) has a large set of geomathematics functions (functions as WPS, provided by Geoserver, and work with them is automated by OpenWebGIS). This function is available through menu item "Calculation->Geomathematics". See Figure 1.
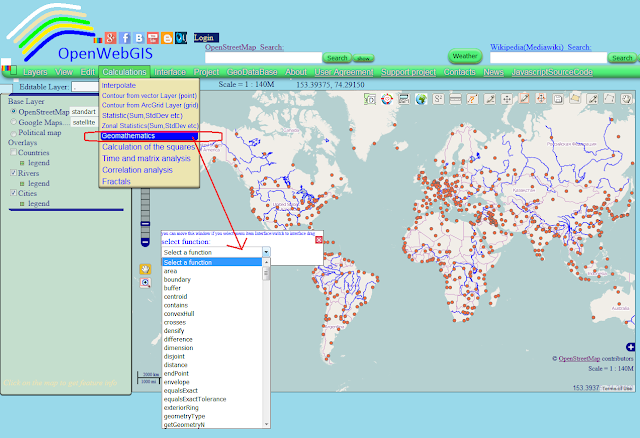
Figure 1- List of geomathematics functions in OpenWebGIS
About each of these functions it is possible to write a separate article, starting with the scientific description of its algorithm and finishing by the method with the help of which the result is added to the map. But in this article we will dwell on the description of mathematical operations on the attributes of map layers. To make mathematical operations on the attributes of the layer, you need to select the name of the layer in the list of "Editable Layer", and then the menu item "Edit-> Open attribute table". Then a window will open for working with attribute information and attribute table. This window is shown in Figure 2.
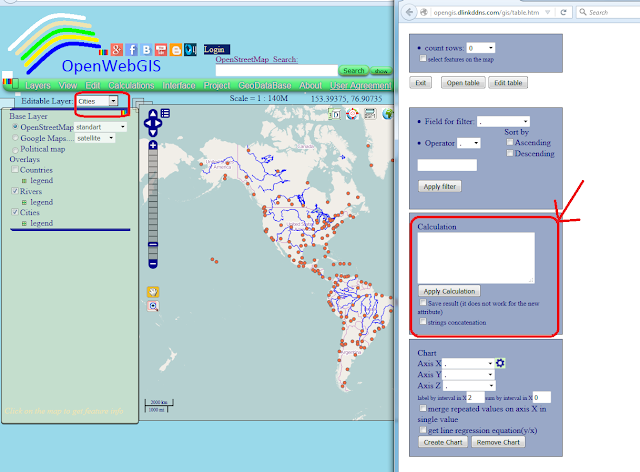
Figure 2 - Attribute table of the Layer


Saturday 28 November 2015

Source code of OpenWeGIS for Android OS on GitHub


Recently the new opportunity has appeared for OpenWebGIS users to download source code for desktop Windows&Linux operating system from GitHub. Please read more about it in the article "Source code of OpenWeGIS on GitHub. Initial commit."
Later the new version of OpenWebGIS for Android operating system was created. You can read about it in details in this article "The OpenWebGIS now as Android app". Ready to use Android apk file for your mobile devices is available for downloading at the following links: mobango.com, aptoide.com, getjar.com and itch.io.
And now it is possible for you to download source code of OpenWebGIS version for Android OS also from GitHub. If you download this code in zip format and unpack, then you can use this version in your work on desktop Windows&Linux operating system if your start in your browser file "OpenWebGIS_for_Android-master/app/src/main/assets/start_openwebgis_en.html.

Saturday 21 November 2015

The OpenWebGIS now as Android app


The OpenWebGIS is a new free&open Geographic Information System (GIS). In this GIS you can use the extensive mathematical functionality to calculate and analyze your data. Using OpenWebGIS you will get a Geographic Information System at your disposal, it may be similar in functionality to some desktop GIS. Please support this project. The OpenWebGIS for Android has online and local versions. In local version, you can use OpenWebGIS without having to connect to the server of OpenWebGIS and even without Internet connection. In local version, some functions do not work, but in future there will be the modification of these functions for the local version. Online full functionality web version of OpenWebGIS is at http://opengis.dlinkddns.com/gis/opengis_eng.html. The OpenWebGIS blog and full list of articles about OpenWebGIS provide a lot of information about possibilities for users' data operating. Online version is adapted for Mozilla Firefox and Google Chrome browsers. In other browsers, OpenWebGIS may not display and work correctly. 
At the moment OpenWebGIS Android apk file is available for downloading  at http://itch.io.  Soon other links will be added.
Last new version always for your mobile devices is available for downloading at itch.io , at Google Drive.
Get link to download OpenWebGIS Android apk file from mobango.com
Get link to download OpenWebGIS Android apk file from aptoide.com
Get link to download OpenWebGIS Android apk file from getjar.com


You can download OpenWebGIS source code from GitHub.  

Saturday 24 October 2015

Source code of OpenWeGIS on GitHub. Initial commit.


Now you can use OpenWebGIS without having to connect to the server of OpenWebGIS and even without Internet connection. For doing this just download OpenWebGIS source code from GitHub.  

Tuesday 20 October 2015

About OpenWebGIS and 3D maps

Please read information about OpenWebGIS and 3D maps at Cesiumjs.org here: http://cesiumjs.org/demos/OpenWebGIS.html.Cesium is a JavaScript library for creating 3D globes and 2D maps in a web browser without a plugin. It uses WebGL for hardware-accelerated graphics, and is cross-platform, cross-browser, and tuned for dynamic-data visualization. Cesium is used in OpenWebGIS primarily to create 3D View of the maps.

Tuesday 13 October 2015

Mona Lisa on the map of OpenWebGIS and QGIS - Art and GIS together


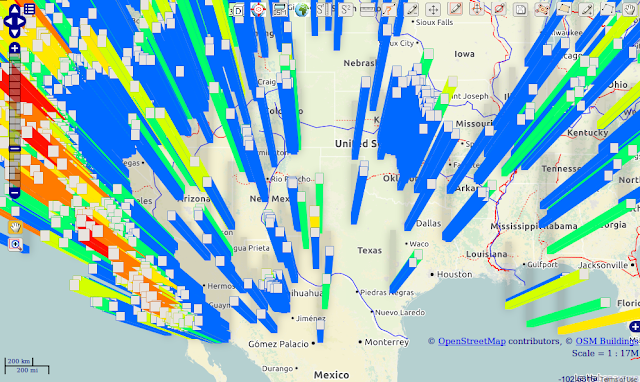
The article "Extrude image to 2D vector, 2.5D and 3D layers on the map" describes the OpenWebGIS function called "Extrude Image". How can this function be used in addition to what was described in the article? For example, you can put your photo on the map and see how it would look like if it is extruded (that means to calculate the height of each pixel depending on its luminance). It can be fun.
 
And let`s put on a map the famous painting titled Mona Lisa. It is a half-length portrait of a woman by the Italian artist Leonardo da Vinci, which has been acclaimed as «the best known, the most visited, the most written about, the most sung about, the most parodied work of art in the world». Take a photo of the painting from Wikipedia and save on your hard disk- see Figure 1.

Wednesday 7 October 2015

Extrude image to 2D vector, 2.5D and 3D layers on the map


In OpenWebGIS a new function has been created to manipulate images.
With the help of this function, you can calculate and get the height (height and altitude) of each pixel of your image. The calculation is performed based on the luminance (brightness) of the pixel. These estimates are used for the creation of:
  1. Vector layer (consisting of squares the number of which is equal or less than a number of pixels - it all depends on the settings you specify);
  2. Layer that consists of 2.5D columns based on "OSM Buildings" technology. For more information about "OSM Buildings" read here: "Integration of OpenWebGIS with OSM Buildings JavaScript library";
  3. The three-dimensional (3D) layer-based technology Cesium. For more information about "Cesium" read here:"3D maps, new version of Cesium JavaScript library and OpenWebGIS".

Sunday 27 September 2015

Spatial and temporal distribution of earthquakes in the USA and adjacent areas (1950-2015)


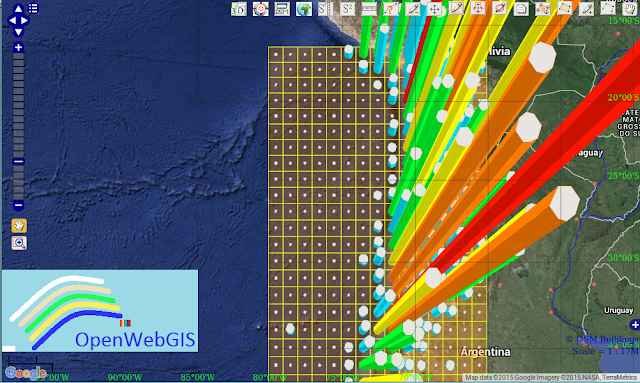
The article is written to demonstrate the new capability of creating animated maps in OpenWebGIS using 2.5D columns. Before reading this article I recommend to read another one: Spatial and temporal distribution of earthquakes in Chile and adjacent areas (1960-2015).

Tuesday 22 September 2015

French interface of OpenWebGIS - Test version/L'interface française de OpenWebGIS - La version de test


OpenWebGIS with French interface is available here.
 
More than a month ago, I asked for help in translating OpenWebGIS interface into other languages. It was described for all users how and what to do in this article: "Help to create a free online OpenWebGIS interface in your own language". At the moment, few people have responded to this call for help to make free and open source software available to more people.
But since I can not wait and want to experiment as soon as possible with the interface in other languages, I translated the interface from English into French with the help of automatic translation (https://translate.google.com). Once again I draw your attention: the translation has been done automatically, so it certainly is full of errors and inaccuracies, but since this is an experiment, I ask not to judge strictly and help me with this translation.

Monday 21 September 2015

Spatial and temporal distribution of earthquakes in Chile and adjacent areas (1960-2015)


Initial data on earthquakes was selected from the database of "Earthquake Archive Search" with the help of menu item in OpenWebGIS: "GeoDataBase-> Earthquakes Database".
For the analysis we choose a rectangle with coordinates:
lower left longitude: -80.131640; lower left latitude: -56.006573; upper right longitude: -65.805468; upper right latitude: -16.608122. Magnitude range: from 5 to 10. Date & Time(UTC): from 1960-01-01T00:00 to 2015-09-21T09:48.

Results from these selecting options from the database shown in Figure 1. Places of earthquakes are marked with orange points.

Thursday 17 September 2015

200 million years of the dinosaurs life (sauropods) in a few seconds on the map


Free online geographic information system (GIS) called OpenWebGIS provides an opportunity to sample data from the Paleobiology Database (Paleontological database). This was described in detail in the article "The information tools(data base and GIS) to help paleontologists in their scientific researches". You can make your selections and apply them automatically on the map using the menu item of OpenWebGIS "GeoDataBase-> Paleobiology database".
OpenWebGIS has various functions to analyze these and other data. For example, users can create animated maps based on attribute with the date/time values. This is described in detail in this article: "Embedding animated maps of OpenWebGIS in your sites". Until the last moment, all the articles on OpenWebGIS stated that: "Dates/times in the field with date must be in format ISO8601: yyyy-mm-ddThh:mm:ss (for example:'2015-09-17T18:00:00'). It is necessary for animation in OpenWebGIS. "

It is well understandable. But how to animate your data if you do not have detailed information about the months, days, minutes, and, for example, there is only a list of years (1996, 1997, 1998 ... 2015)? Let`s assume it can be solved by adding to the data field with the years the following string ('-01-01T00: 00: 00'). But thus how to animate processes that lasted millions of years?

Tuesday 8 September 2015

3D maps, new version of Cesium JavaScript library and OpenWebGIS


Recently, the release of the new version (v. 1.13) of Cesium JavaScript library has been announced. Cesium is an open source JavaScript library for creating 3D globes and 2D maps in a web browser without a plugin. It uses WebGL for hardware-accelerated graphics, and is cross-platform, cross-browser, and tuned for dynamic-data visualization.
Cesium is used in OpenWebGIS primarily to create 3D View of the maps. Until recently OpenWebGIS has used the version 1.3 of Cesium. But at last it has begun to use the most recent version of Cesium at the moment. It will give a new impetus to the development of a 3D map in the scope of OpenWebGIS project. For example, users have already had a new opportunity to work with 3D maps: you can now get an url link on your 3D map (previously it was only possible for 2D maps). In addition to the contents of the map in the link, the position and area size of 3D map, is saved. In order to make a link, create your 3D map, and click the button ("Get link ...") at the top right corner of the map as it is shown in Figure 1. After that the pop-up window will appear with options for creating the link. 
Figure 1
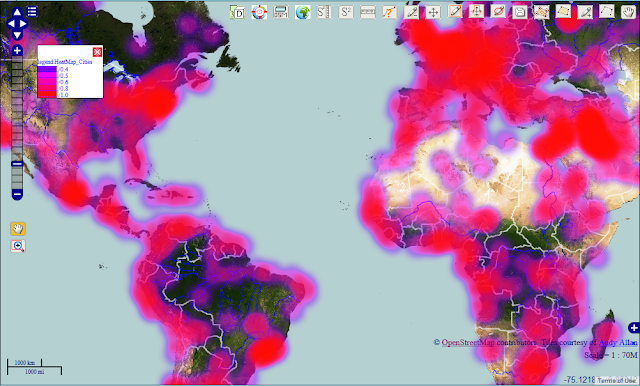
For example take a look at this link to the map with a heatmap of a number of population in cities.

Tuesday 1 September 2015

The spatial distribution of Great earthquakes from 1905 to 2014 all around the world


Look at the interesting map of the most destructive earthquakes (with magnitude of 8 to 10 values) from 1905 to 2014. The data for this map was taken from USGS. USGS is a science bureau within the United States Department of the Interior. It can be available with menu item of OpenWebGIS: "GeoDataBase-> Earthquakes Database".

Monday 31 August 2015

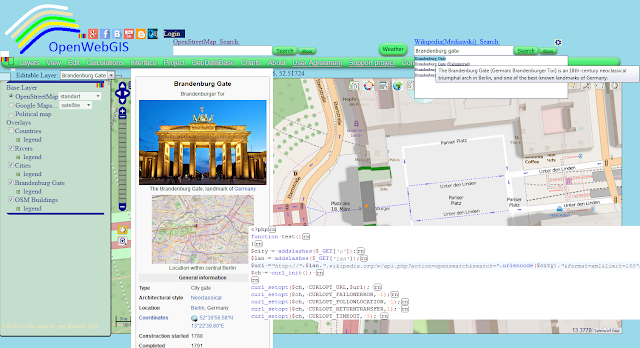
Integrating your map service and Wikipedia using JavaScript and PHP


Wikipedia contains a huge amount of information that has a geographic reference. For example, coordinates of cities, tourist attractions, urban infrastructure - railway stations, airports, bridges, etc. And no doubt many developers of online map services (or GIS) and their users would like to have a quick access to this information and if needed to have it automatically added on the map with the attribute information. In this article you will get the information on how to do it yourself with the help of JavaScript and PHP languages.

Saturday 29 August 2015

Maps, hurricanes and linear regression equation (correlation) in OpenWebGIS using JavaScript


When you create your maps with the help of online services, sometimes you surely want not only to see your data on the map, but also to make at least some mathematical analysis. For example, to create a chart reflecting the change in the data and to estimate how much your data is correlated in some attributes and to construct a linear regression equation. Not every online service for maps creation provides such an opportunity. In OpenWebGIS you can do it. In this article, we'll start talking about how you can do it yourself in your service using JavaScript language.
The whole code you can see in the function "ApplyChart" in the file "table.htm", if you download the javascript code using the menu item of OpenWebGIS "JavascriptSourceCode".

Friday 28 August 2015

How to create a heatmap on the map using JavaScript, Openlayers and canvas

This article is a continuation of the article “Heatmap and Interpolation: it is easy in OpenWebGIS” about creation of Heatmap and Interpolation with the help of OpenWebGIS interface. We are now describing the process of creating a heatmap, based on any point layer, using JavaScript, OpenLayers 2.x and canvas element (as part of HTML5 technology). 
Please read  more about it in my article here:Heatmap, JavaScript, Openlayers and canvas

Monday 24 August 2015

Heatmap and Interpolation in OpenWebGIS (very easy and interestingly)


In this article we consider the creation of Heatmap and Interpolation with the help of OpenWebGIS interface. In the next article it is planned to describe its technical implementation using JavaScript, OpenLayers 2.x and canvas element (as part of HTML5 technology). Recently, in an article “Some new (June 2015) features and functions in OpenWebGIS” it has been announced to revise the interpolation module completely. This promise has been kept, and at the moment in OpenWebGIS you can build a heatmap and make interpolation by the method of Inverse Distance Weighting (IDW).
Please read more in digital-geography.com

Monday 17 August 2015

Help to create a free online OpenWebGIS interface in your own language


Finally, the opportunity has appeared to use OpenWebGIS in any language convenient to you, not just English. But it needs your help, dear users of OpenWebGIS. Let's create an effective community of OpenWebGIS users! 
To do this, translate the attached file from English into any convenient to you language and send me this file. There is no need to translate all the rows in the file, you can translate only the rows that you can. I am sure that those who use OpenWebGIS will be grateful to you, the translation authors will be specified as the collaboraters of OpenWebGIS. But to make it work, the file with the translation should be prepared according to the rules described below! Please, before you send the file translation, check that it is formed in the format described below. Please do not translate it automatically using any translation software. It is better to make an "alive" translation that will be easy for people to understand.
So how you can help in the development of the online geographical information system:
1. Download the file Interface_text.txt or Interface_text.zip
2. Open it and examine the structure. The text in the file should look as shown in Figure 1 or Figure 2 and 3. In Figure 1 the file is opened in a text editor AkelPad. In Figures 2 and 3 it is done in Microsoft Word.

Monday 10 August 2015

Layer Styling, SLD file, OpenWebGIS and QGIS


A Styled Layer Descriptor (SLD) is an XML schema specified by the Open Geospatial Consortium (OGC) for describing the appearance of map layers. It is capable of describing the rendering of vector and raster data. Using SLD provides a lot of convenience when working with GIS as it allows to save the layer style separately from the map (layer) and to use it in other projects or other softwares.
In this regard, recently in OpenWebGIS the new feature has been added which allows to change the legend (style) vector layers of the map using SLD files. OpenWebGIS users can apply their SLD files, that were created by other software, and they can also export the layer style, that was created with the help of OpenWebGIS, in the SLD file and use it in other Geographic Information System (GIS) programs such as the QGIS. To import your legend (style) in a single SLD file you need to select the menu item  "Edit-> Import / Export SLD legend". Then select layer name (in this case, "Cities") from the list "Select the Layer:" which style you want to export to a SLD file and click "Export legend to SLD" (see Figure 1).  
 
Figure 1.


Monday 3 August 2015

List of articles about OpenWebGIS in chronological order (descending) according to their writing


One of the methods to create and use offline base maps for web based GIS, JavaScript example

http://openwebgisystem.blogspot.com/2016/07/one-of-methods-to-create-and-use.html

Earthquake in Ecuador on 17 April 2016 - foreshocks, mainshock and aftershocks 

http://openwebgisystem.blogspot.com/2016/04/earthquake-in-ecuador-on-17-april-2016.html

OpenWebGIS: An open source geographic information system

https://opensource.com/life/16/3/openwebgis

Mapping information from Paleobiology and Global Biodiversity databases in OpenWebGIS

http://openwebgisystem.blogspot.com/2016/03/mapping-information-from-paleobiology.html

Customizing of OpenWebGIS interface to create your own workspace 

http://openwebgisystem.blogspot.com/2016/03/customizing-of-openwebgis-interface-to.html

Maps online with OpenStreetMap and OSMBuildings free programs topography - Aprende topografía urbana OpenStreetMap y Osmbuildings (article in Spanish)

http://ovacen.com/topografia-openstreetmap-osmbuildings

New feature of OpenWebGIS - mapping data from GBIF, and new Contributors

Thanks to our Contributors, join them, support an open source project OpenWebGIS!

http://openwebgisystem.blogspot.com/2016/03/thanks-to-our-contributors-join-them.html

OpenWebGis un open source per la visualizzazione web o mobile di sistemi informativi geografici (article in Italian)


http://openwebgisystem.blogspot.com/2016/02/developing-new-interface-design-of.html

Support OpenWebGIS crowdfunding campaign

https://openwebgisystem.blogspot.com/2016/02/3d-view-enhancements-in-openwebgis.html

Web Mapping, Part 2

http://www.xyht.com/spatial-itgis/web-mapping-part-2/

Creating WiFi map and monitoring access points based on geographic information system (OpenWebGIS) 

http://openwebgisystem.blogspot.com/2016/01/creating-wifi-map-and-monitoring-access.html

Use maps and sensors in your phone as one tool with the help of OpenWebGIS 

http://openwebgisystem.blogspot.com/2016/01/use-maps-and-sensors-in-your-phone-as.html

Mathematical operations in OpenWebGIS (on the attributes of map layers)

http://openwebgisystem.blogspot.com/2015/12/mathematical-operations-in-openwebgis.html

Web mapping (Part 1, The Basics)

http://www.xyht.com/spatial-itgis/web-mapping

Source code of OpenWeGIS for Android OS on GitHub 

http://openwebgisystem.blogspot.com/2015/11/source-code-of-openwegis-for-android-os.html

The OpenWebGIS now as Android app

http://openwebgisystem.blogspot.com/2015/11/the-openwebgis-now-as-android-app.html

Source code of OpenWeGIS on GitHub. Initial commit.


About OpenWebGIS and 3D maps at Cesiumjs.org


Mona Lisa on the map of OpenWebGIS and QGIS - Art and GIS together 


Extrude image to 2D vector, 2.5D and 3D layers on the map 

http://openwebgisystem.blogspot.com/2015/10/extrude-image-to-2d-vector-25d-and-3d.html

Spatial and temporal distribution of earthquakes in the USA and adjacent areas (1950-2015)

http://openwebgisystem.blogspot.com/2015/09/spatial-and-temporal-distribution-of_27.html

French interface of OpenWebGIS - Test version/L'interface française de OpenWebGIS - La version de test


Help to create a free online OpenWebGIS interface in your own language

http://openwebgisystem.blogspot.com/2015/08/help-to-create-free-online-openwebgis.html

Spatial and temporal distribution of earthquakes in Chile and adjacent areas (1960-2015)

http://openwebgisystem.blogspot.com/2015/09/spatial-and-temporal-distribution-of_21.html

200 million years of the dinosaurs life (sauropods) in a few seconds on the map

http://openwebgisystem.blogspot.com/2015/09/200-million-years-of-dinosaurs-life.html

3D maps, new version of Cesium JavaScript library and OpenWebGIS

http://openwebgisystem.blogspot.com/2015/09/3d-maps-new-version-of-cesium.html


Integrating your map service and Wikipedia using JavaScript and PHP

http://openwebgisystem.blogspot.com/2015/08/integrating-your-map-service-and.html

Maps, hurricanes and linear regression equation (correlation) in OpenWebGIS using JavaScript

http://openwebgisystem.blogspot.com/2015/08/maps-hurricanes-and-linear-regression.html
 
How to create a heatmap on the map using JavaScript, Openlayers and canvas

http://openwebgisystem.blogspot.com/2015/08/how-to-create-heatmap-on-map-using.html

Heatmap and Interpolation: it is easy in OpenWebGIS

http://www.digital-geography.com/heatmap-interpolation-easy-openwebgis

Layer Styling, SLD file, OpenWebGIS and QGIS


SIG Online ¡Open Source! ¡3D!
 
http://mundocartogeo.blogspot.mx/2015/08/sig-online-open-source-3d.html

Weather in OpenWebGIS

http://openwebgisystem.blogspot.com/2015/07/weather-in-openwebgis.html


Import/export of OpenStreetMap vector data using OpenWebGIS

http://openwebgisystem.blogspot.com/2015/07/importexport-of-openstreetmap-vector.html

Top 10 tallest freestanding structures on the map

http://openwebgisystem.blogspot.com/2015/06/top-10-tallest-freestanding-structures.html

Some new (June 2015) features and functions in OpenWebGIS

http://openwebgisystem.blogspot.com/2015/06/some-new-june-2015-features-and.html

Integration of OpenWebGIS with “OSM Buildings” JavaScript library

http://blog.osmbuildings.org/2015/06/integration-of-openwebgis-with-osm.html


Animation of earthquakes (including aftershocks) in Nepal on 25 April by hours

http://openwebgisystem.blogspot.com/2015/04/animation-of-earthquakes-including.html

Customizing legend of the layer with cluster strategy of OpenWebGIS

http://openwebgisystem.blogspot.com/2015/04/customizing-legend-of-layer-with.html

Embedding animated maps of OpenWebGIS in your sites or blogs.

http://openwebgis.livejournal.com/13063.html

History maps with the help of OpenWebGIS. Examples.

http://openwebgis.livejournal.com/12882.html

Sunday 26 July 2015

Weather in OpenWebGIS


For the convenience of users in the OpenWebGIS  the weather module has been recently updated to visualize the weather on the map from two sources, that offer free API for everyone.


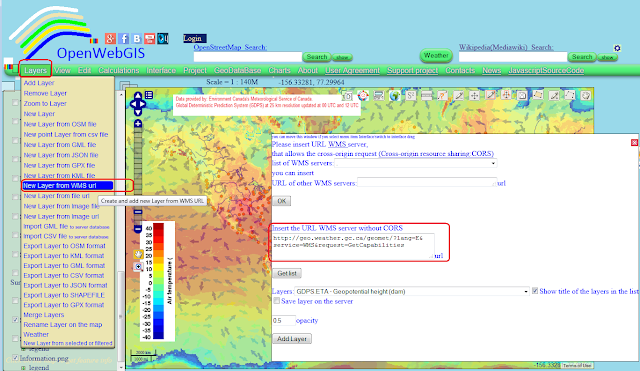
In the article "The meteorological service based on OpenWebGIS" there was an example of the use of meteorological information in OpenWebGIS from external sources (WMS layers). In this example layers were added using the menu item "Layers-> Create and add new Layer from WMS URL" (See Figure 1). Layers legend was added in the form of images using the menu item "Layers-> Create and add new Layer from Image file". The above example shows that each user of OpenWebGIS can create their own service based on OpenWebGIS from the desired sources.

Figure 1.
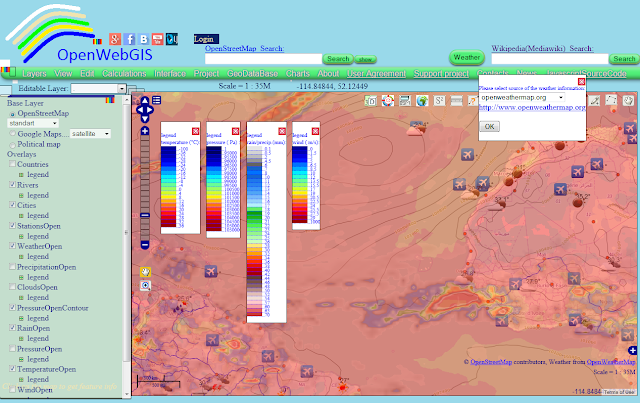
Besides this method of adding data about the weather (of course the data can be added not only about the weather) for the convenience of users in the OpenWebGIS weather module has been recently updated to visualize the weather on the map from two sources, that offer free API for everyone. Weather API (application programming interface) allows developers and programmers to access current, past and future weather data for use in apps and on websites. Weather information is taken from two sources: http://www.worldweatheronline.com and http://www.openweathermap.org. Select them by using the menu item "Layers-> Weather" button or "Weather". (See Figure 2).

Saturday 11 July 2015

Import/export of OpenStreetMap vector data using OpenWebGIS


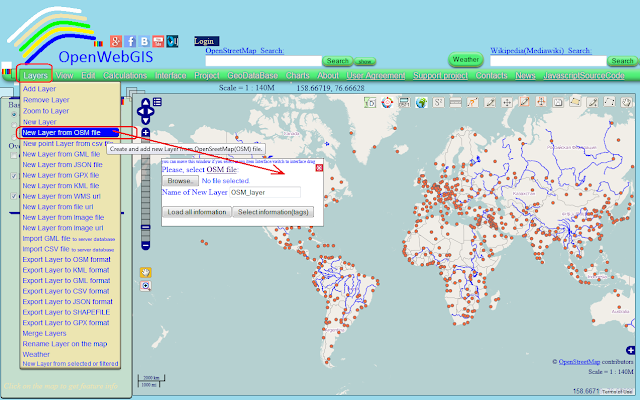
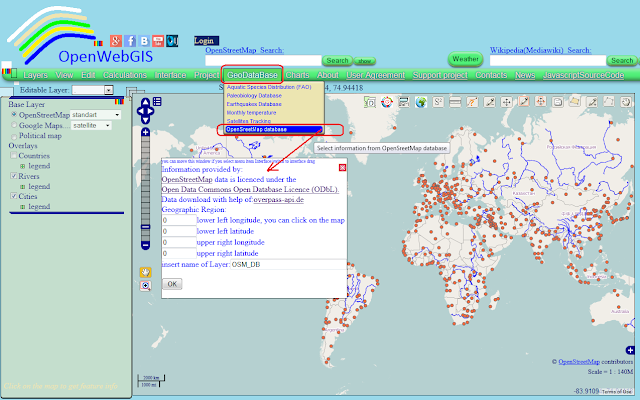
In OpenWebGIS now there is an opportunity to download OpenStreetMap data from a file or directly from the OpenStreetMap server. To download from the file you need to select the menu item "Layers" -> "New layer from OSM file" (See Figure 1). To download from the server you need to choose the menu item "GeoDataBase" -> "OpenSreetMap database" (See Figure 2). After selecting these menu items, the corresponding windows with the settings will appear (they are shown in the pictures with red arrows).
Figure 1
Figure 2


Sunday 21 June 2015

Top 10 tallest freestanding structures on the map


All buildings views (like 3D) given in this article were created with the help of OpenWebGIS and OSM Buildings. Read more about the integration of OpenWebGIS and OSM Buildings here: http://blog.osmbuildings.org/2015/06/integration-of-openwebgis-with-osm.html. At the end of the article there will be a description of how to create such maps in OpenWebGIS by yourselves.

10. The Willis Tower. Pinnacle height: 527 m; opening year 1974. It was built as and still commonly referred to as Sears Tower, is a 108-story, 1,451-foot (442 m) skyscraper in Chicago, Illinois, United States. See Figure 1 and open Map 1.

Wednesday 17 June 2015

Some new (June 2015) features and functions in OpenWebGIS


1. More opportunities for setting up the interface. Now, the main menu can be both horizontal and vertical. To do this, click on the appropriate button on the left on the main menu (see Figure 1 and Figure 2). After changing the color of the main menu and moving the menu in a convenient place for you (after you select the menu item "Interface" -> "Switch to interface drag") your interface might look like it is shown in Figure 3, or directly on the site of OpenWebGIS
Figure 1

Saturday 25 April 2015

Animation of earthquakes (including aftershocks) in Nepal on 25 April by hours

Animation of earthquakes (including aftershocks) in Nepal from 2015-04-25T07:00:00 to 2015-04-25T23:07:17 by hours.
Сondolences to the families of the victims!
Data for this map was taken from USGS. USGS is a science bureau within the United States Department of the Interior. It can be available with menu item of  OpenWebGIS: "GeoDataBase->Earthquakes Database"
Figure 1. -general view of earthquakes.


Map 1 - Animation of earthquakes (including aftershocks) in Nepal from 2015-04-25T07:00:00 to 2015-04-25T23:07:17 by hours.

You can analyze this data using all the opportunities of OpenWebGIS interface if you open this web-link.

Customizing legend of the layer with cluster strategy of OpenWebGIS

What is clustering features on the map? - This is merging of close to each other features in one feature. What may it be useful for? - It may be necessary when a large number of features clutters the map and a user wants to hide the excessive information at the moment. As well clustering is useful when it is needed to get information on the amount of any objects on a territory quickly  - not counting them  and without using the menu item "Calculation". Let's look at some examples.

Example 1. Major cities on the world map without clustering shown in Figure 1
Figure 1


After applying the clustering method in the legends settings layer "Cities", the map can look like shown in Map 1.
Map 1

Friday 24 April 2015

Embedding animated maps of OpenWebGIS in your sites

Now the new opportunity has appeared to embed animated maps in your site or blog. Have a look at the example of such embedding on the Map 1 and in Figure 1a (source map). This article uses the maps that contain a lot of animated data, and therefore for their correct displaying the fast internet is desired. If you have a problem with the map displaying, try to refresh the page.
Figure 1a.

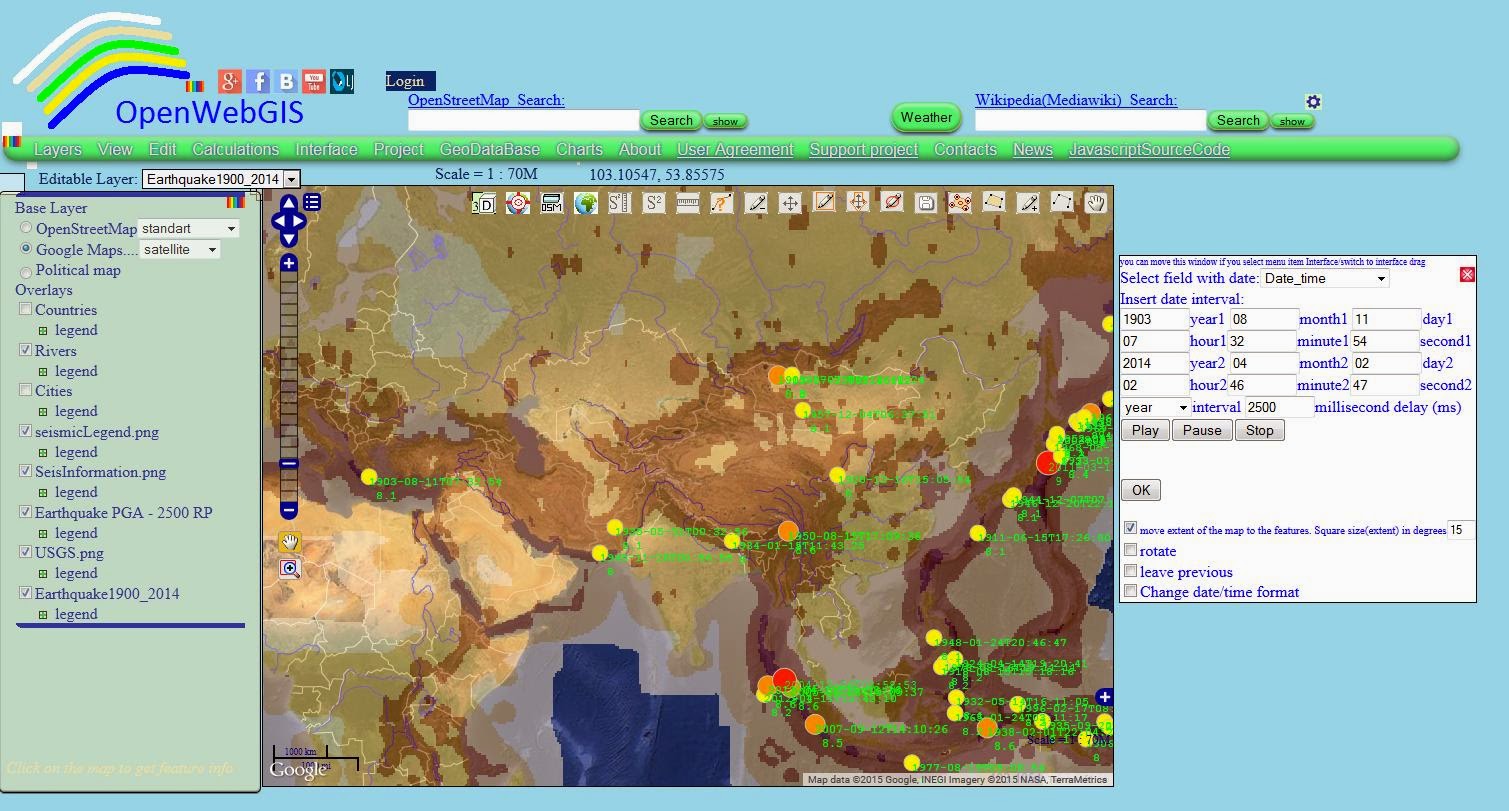
Map 1-The animated map of the earthquakes all over the world with magnitude 8 and more in 1900-2014 years. For this map the time interval for each year is set - 2500 milliseconds. For further information about this map you can read here

Animated maps in OpenWebGIS are understood as maps, on which there are layers containing the attribute with the date/time values and where with the help of the "Time Line" function is started the process of  layer changes drawing according to date/time changes.
Instruction on how to animate your OpenWebGIS map can be read in this article: http://openwebgis.livejournal.com/643.html or see this video:

Saturday 18 April 2015

Feel the history with the help of OpenWebGIS. Examples

Use the opportunities of free and open geographic information system OpenWebGIS to create your maps and share them with friends and colleagues. As example study the map of ancient roads and ports in Italy and surrounding areas. See this map on Figure 1 and use embedding interractive map - Map 1. About how to embed OpenWebGIS map in your sites or blogs read the article: http://openwebgisystem.blogspot.com/2015/04/blog-post.html
 Figure 1.

Map 1.

Thursday 16 April 2015

Embedding maps created with the help of OpenWebGIS in your websites or blogs. Examples.


Why can it be convenient for you to use and embed OpenWebGIS maps in your sites and blogs? Because it is a completely free online project without advertising. You can use the extensive mathematical functionality to calculate and analyze your data, you can create 3D map. Using OpenWebGIS you will get online a Geographic Information System at your disposal, it may be similar in functionality to some desktop GIS. You can get some ideas of the OpenWebGIS possibilities, if you read the article from this list.


In order to get a web-link or an embedding code, click on the globe icon in the toolbar on the map (see Figure 1).

Figure 1.


You can read more about creating a web-link in this article. To get an embedding code of your map you must use the area of pop-up window (it appears after clicking on the globe icon) that is highlighted with the green rectangle in Figure 1.


There can be several variants:
The First variant. Just click on the button "Yes - get code"(see Figure 2). After clicking this button the embedding code of the map will appear in the appropriate text area "embedding code:". Select, copy and insert this code in your site code.


Figure 2.


Then the result will be the map with all toolbars on the map. But if you reduced or increased the size of the map (the default size of which is the 1000 pixels width and the 600 pixels height), then after code inserting in your site, the map will be embedded in the default size and  therefore it can be cut on the right or on the left (for example not all buttons will be visible on the top of the map) as it is shown in the Map 1. You can watch the video on how to change the map size  (including the usage of the “additional toolbar. Set size of the Map” button):


Map 1.


So in order to save the map size and the interface while embedding it is necessary to activate the checkbox “save interface” before pressing the button "Yes - get code" (see Figure 3). The result can be seen in the embedded Map 2.


Figure 3