For the
convenience of users in the OpenWebGIS the weather module has been recently updated to
visualize the weather on the map from two sources, that offer free API for
everyone.
In the article "The meteorological service based on OpenWebGIS" there
was an example of the use of meteorological information in OpenWebGIS from external
sources (WMS layers). In this example layers were added using the menu item
"Layers-> Create and add new Layer from WMS URL" (See Figure 1). Layers legend was added in the form of images using the menu item
"Layers-> Create and add new Layer from Image file". The above
example shows that each user of OpenWebGIS can create their own service based
on OpenWebGIS from the desired sources.
 |
| Figure 1. |
Besides this method of adding data about the
weather (of course the data can be added not only about the weather) for the
convenience of users in the OpenWebGIS weather module has been recently updated to
visualize the weather on the map from two sources, that offer free API for
everyone. Weather API (application programming interface) allows developers and
programmers to access current, past and future weather data for use in apps and
on websites. Weather information is taken from two sources:
http://www.worldweatheronline.com and http://www.openweathermap.org.
Select them by using the menu item "Layers-> Weather" button or
"Weather". (See Figure 2).
 |
| Figure 2. |
In OpenWebGIS with the help of a source
www.worldweatheronline.com you get access to the weather at any point given by
you on the map (in this case the nearest weather station is automatically found
and the data, that it provides, is displayed). Click on the "Weather"
button, then a pop-up window appears where you can select
worldweatheronline.com as a source of the weather information. Click "OK" button,
after that there will be an additional window where you can enter the
coordinates you are interested in (in the format of longitude; latitude), or
simply click on the map. (See Figure 3).
 |
| Figure 3. |
Then in this additional window click "OK" button and
you will get the current weather at this point as it is shown in Figure 4. To
get the weather forecast at this point, click "forecast" button and
you will get the result as in Figure 5.
 |
| Figure 4. |
 |
| Figure 5. |
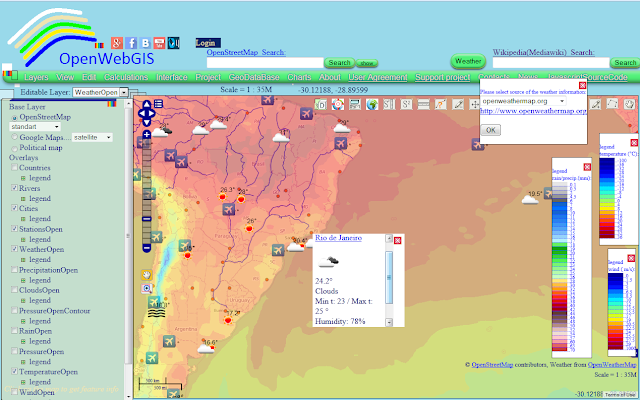
In OpenWebGIS with the help of a source www.openweathermap.org you get access to the weather in specific
locations and spatial distribution of meteorological parameters such as
precipitation, rain, snow, clouds, sea level pressure, sea level pressure
contour, temperature, wind speed. To get this information click
"Weather" button, then there will be a pop-up window where you can select openweathermap.org as a source of the weather information. Click "OK" button,
and then in the list of layers to the left of the map all layers will be
immediately added. They contain the information about the weather and on the
map places markers are put where the data from meteorological stations is
available. (See Figure 6).
 |
| Figure 6. |
In the layers list activate the layer you are
interested in (tick the layer name) and the data in the form of spatial
distribution will appear all over the map (for example, temperatures distribution, see Figure 7).
 |
| Figure 7. |
You can
drag the windows with legends of weather layers in any place, if you click on the menu item "Interface-> switch to
interface drag". (See Figure 8).
 |
| Figure 8. |
To receive the weather in the presence of local
weather stations, select the layer name "StationsOpen" "WeatherOpen" (current
weather for cities) in the list of "Editable Layer". Then click (on
the map) on the point (icon of sun, clouds and so on) you are interested in.
The values of all attributes of the point you can see by hovering the cursor
over it and clicking on it (if while hovering over a feature, it is not
activated, then move the map a little bit and then again hover the cursor).
After clicking on the feature you are interested in, the pop-up window will be
opened. In this window you will see all weather attributes. (See Figure 9).
 |
| Figure 9. |
You can look at the ready weather map (created on
the base of www.openweathermap.org)
with the activated wind layer at this link.
You can read about creating a web-link to the map in this article
http://openwebgis.livejournal.com/12177.html. Read about embedding maps created
with the help of OpenWebGIS in your websites or blogs in this article:
http://openwebgisystem.blogspot.ru/2015/04/blog-post.html.
See the whole process of adding weather data on the map of OpenWebGIS in this video:
See the whole process of adding weather data on the map of OpenWebGIS in this video:
The users
of OpenWebGIS can offer some other open sources of weather information. Write
about it in the comments and if it is possible the access to them will be added
to OpenWebGIS. The advantage of weather data visualization in OpenWebGIS,
compared to many other existing online weather services, is that the users of
OpenWebGIS can not only view the data, but they also can put any their layers (containing any
information, not only the weather) and analyze simultaneously the
information from different sources.

No comments:
Post a Comment