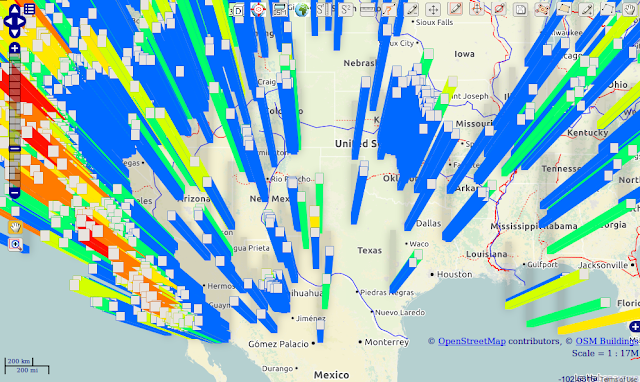
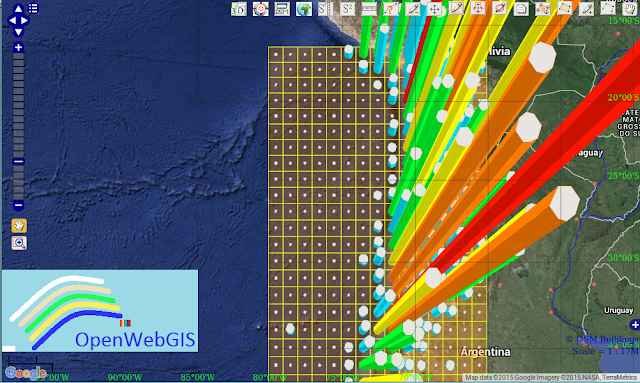
The article is written to demonstrate the new capability of creating animated maps in OpenWebGIS using 2.5D columns. Before reading this article I recommend to read another one: Spatial and temporal distribution of earthquakes in Chile and adjacent areas (1960-2015).
For everyone who wishes to see and use a new free&open GIS called OpenWebGIS and make comments and suggestions. You can use the extensive mathematical functionality to calculate and analyze your data. Using OpenWebGIS you will get online/offline a Geographic Information System at your disposal, it may be similar in functionality to some desktop GIS. Please support this project.
Search This Blog
Sunday 27 September 2015
Tuesday 22 September 2015
French interface of OpenWebGIS - Test version/L'interface française de OpenWebGIS - La version de test
OpenWebGIS with French interface is available here.
More than a month ago, I asked for help in translating OpenWebGIS interface into other languages. It was described for all users how and what to do in this article: "Help to create a free online OpenWebGIS interface in your own language". At the moment, few people have responded to this call for help to make free and open source software available to more people.
But since I can not wait and want to experiment as soon as possible with the interface in other languages, I translated the interface from English into French with the help of automatic translation (https://translate.google.com). Once again I draw your attention: the translation has been done automatically, so it certainly is full of errors and inaccuracies, but since this is an experiment, I ask not to judge strictly and help me with this translation.
But since I can not wait and want to experiment as soon as possible with the interface in other languages, I translated the interface from English into French with the help of automatic translation (https://translate.google.com). Once again I draw your attention: the translation has been done automatically, so it certainly is full of errors and inaccuracies, but since this is an experiment, I ask not to judge strictly and help me with this translation.
Monday 21 September 2015
Spatial and temporal distribution of earthquakes in Chile and adjacent areas (1960-2015)
Initial data on earthquakes was selected from the database of "Earthquake Archive Search" with the help of menu item in OpenWebGIS: "GeoDataBase-> Earthquakes Database".
For the analysis we choose a rectangle with coordinates:
lower left longitude: -80.131640; lower left latitude: -56.006573; upper right longitude: -65.805468; upper right latitude: -16.608122. Magnitude range: from 5 to 10. Date & Time(UTC): from 1960-01-01T00:00 to 2015-09-21T09:48.
For the analysis we choose a rectangle with coordinates:
lower left longitude: -80.131640; lower left latitude: -56.006573; upper right longitude: -65.805468; upper right latitude: -16.608122. Magnitude range: from 5 to 10. Date & Time(UTC): from 1960-01-01T00:00 to 2015-09-21T09:48.
Results from these selecting options from the database shown in Figure 1. Places of earthquakes are marked with orange points.
Thursday 17 September 2015
200 million years of the dinosaurs life (sauropods) in a few seconds on the map
Free online geographic information system (GIS)
called OpenWebGIS provides an
opportunity to sample data from the Paleobiology Database (Paleontological
database). This was described in detail in the article "The information tools(data base and GIS) to help paleontologists in their scientific researches". You can make your selections and apply them
automatically on the map using the menu item of OpenWebGIS "GeoDataBase->
Paleobiology database".
OpenWebGIS has various functions to analyze
these and other data. For example, users can create animated maps based on
attribute with the date/time values. This is described in detail in this
article: "Embedding animated maps of OpenWebGIS in your sites".
Until the last moment, all the articles on OpenWebGIS stated that: "Dates/times in the field with date must be in format ISO8601: yyyy-mm-ddThh:mm:ss
(for example:'2015-09-17T18:00:00'). It is necessary for
animation in OpenWebGIS. "
It is well understandable. But how to animate
your data if you do not have detailed information about the months, days,
minutes, and, for example, there is only a list of years (1996, 1997, 1998 ...
2015)? Let`s assume it can be solved by adding to the data field with the years
the following string ('-01-01T00: 00: 00'). But thus how to animate processes
that lasted millions of years?
Tuesday 8 September 2015
3D maps, new version of Cesium JavaScript library and OpenWebGIS
Recently, the release of the new version (v. 1.13) of Cesium JavaScript library has been announced. Cesium is an open source JavaScript library for creating 3D globes and 2D maps in a web browser without a plugin. It uses WebGL for hardware-accelerated graphics, and is cross-platform, cross-browser, and tuned for dynamic-data visualization.
Cesium is
used in OpenWebGIS primarily to create 3D View of the maps. Until recently
OpenWebGIS has used the version 1.3 of Cesium. But at last it has begun to use
the most recent version of Cesium at the moment. It will give a new impetus to
the development of a 3D map in the scope of OpenWebGIS project. For example,
users have already had a new opportunity to work with 3D maps: you can now get
an url link on your 3D
map (previously it was only possible for 2D maps). In addition to the contents
of the map in the link, the position and area size of 3D map, is saved. In
order to make a link, create your 3D map, and click the button ("Get link
...") at the top right corner of the map as it is shown in Figure 1. After
that the pop-up window will appear with options for creating the link.
 |
| Figure 1 |
For example
take a look at this link to the map with a heatmap of a number of population in
cities.
Tuesday 1 September 2015
The spatial distribution of Great earthquakes from 1905 to 2014 all around the world
Look at the interesting map of the most destructive earthquakes (with magnitude of 8 to 10 values) from 1905 to 2014. The data for this map was taken from USGS. USGS is a science bureau within the United States Department of the Interior. It can be available with menu item of OpenWebGIS: "GeoDataBase-> Earthquakes Database".
Subscribe to:
Posts (Atom)


