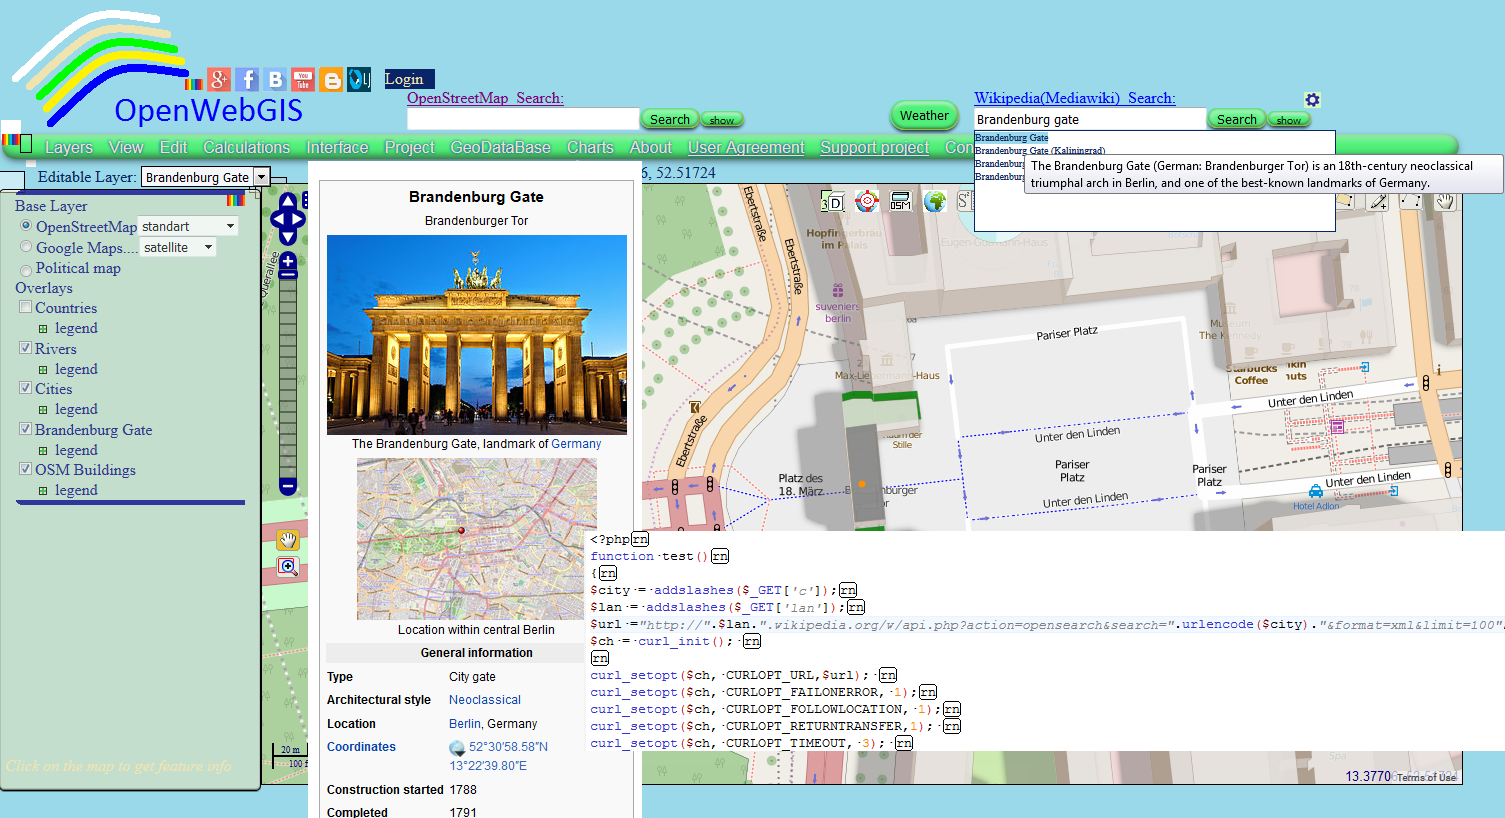
Search This Blog

Monday 31 August 2015

Integrating your map service and Wikipedia using JavaScript and PHP


Wikipedia contains a huge amount of information that has a geographic reference. For example, coordinates of cities, tourist attractions, urban infrastructure - railway stations, airports, bridges, etc. And no doubt many developers of online map services (or GIS) and their users would like to have a quick access to this information and if needed to have it automatically added on the map with the attribute information. In this article you will get the information on how to do it yourself with the help of JavaScript and PHP languages.

Saturday 29 August 2015

Maps, hurricanes and linear regression equation (correlation) in OpenWebGIS using JavaScript


When you create your maps with the help of online services, sometimes you surely want not only to see your data on the map, but also to make at least some mathematical analysis. For example, to create a chart reflecting the change in the data and to estimate how much your data is correlated in some attributes and to construct a linear regression equation. Not every online service for maps creation provides such an opportunity. In OpenWebGIS you can do it. In this article, we'll start talking about how you can do it yourself in your service using JavaScript language.
The whole code you can see in the function "ApplyChart" in the file "table.htm", if you download the javascript code using the menu item of OpenWebGIS "JavascriptSourceCode".

Friday 28 August 2015

How to create a heatmap on the map using JavaScript, Openlayers and canvas

This article is a continuation of the article “Heatmap and Interpolation: it is easy in OpenWebGIS” about creation of Heatmap and Interpolation with the help of OpenWebGIS interface. We are now describing the process of creating a heatmap, based on any point layer, using JavaScript, OpenLayers 2.x and canvas element (as part of HTML5 technology). 
Please read  more about it in my article here:Heatmap, JavaScript, Openlayers and canvas

Monday 24 August 2015

Heatmap and Interpolation in OpenWebGIS (very easy and interestingly)


In this article we consider the creation of Heatmap and Interpolation with the help of OpenWebGIS interface. In the next article it is planned to describe its technical implementation using JavaScript, OpenLayers 2.x and canvas element (as part of HTML5 technology). Recently, in an article “Some new (June 2015) features and functions in OpenWebGIS” it has been announced to revise the interpolation module completely. This promise has been kept, and at the moment in OpenWebGIS you can build a heatmap and make interpolation by the method of Inverse Distance Weighting (IDW).
Please read more in digital-geography.com

Monday 17 August 2015

Help to create a free online OpenWebGIS interface in your own language


Finally, the opportunity has appeared to use OpenWebGIS in any language convenient to you, not just English. But it needs your help, dear users of OpenWebGIS. Let's create an effective community of OpenWebGIS users! 
To do this, translate the attached file from English into any convenient to you language and send me this file. There is no need to translate all the rows in the file, you can translate only the rows that you can. I am sure that those who use OpenWebGIS will be grateful to you, the translation authors will be specified as the collaboraters of OpenWebGIS. But to make it work, the file with the translation should be prepared according to the rules described below! Please, before you send the file translation, check that it is formed in the format described below. Please do not translate it automatically using any translation software. It is better to make an "alive" translation that will be easy for people to understand.
So how you can help in the development of the online geographical information system:
1. Download the file Interface_text.txt or Interface_text.zip
2. Open it and examine the structure. The text in the file should look as shown in Figure 1 or Figure 2 and 3. In Figure 1 the file is opened in a text editor AkelPad. In Figures 2 and 3 it is done in Microsoft Word.

Monday 10 August 2015

Layer Styling, SLD file, OpenWebGIS and QGIS


A Styled Layer Descriptor (SLD) is an XML schema specified by the Open Geospatial Consortium (OGC) for describing the appearance of map layers. It is capable of describing the rendering of vector and raster data. Using SLD provides a lot of convenience when working with GIS as it allows to save the layer style separately from the map (layer) and to use it in other projects or other softwares.
In this regard, recently in OpenWebGIS the new feature has been added which allows to change the legend (style) vector layers of the map using SLD files. OpenWebGIS users can apply their SLD files, that were created by other software, and they can also export the layer style, that was created with the help of OpenWebGIS, in the SLD file and use it in other Geographic Information System (GIS) programs such as the QGIS. To import your legend (style) in a single SLD file you need to select the menu item  "Edit-> Import / Export SLD legend". Then select layer name (in this case, "Cities") from the list "Select the Layer:" which style you want to export to a SLD file and click "Export legend to SLD" (see Figure 1).  
 
Figure 1.


Monday 3 August 2015

List of articles about OpenWebGIS in chronological order (descending) according to their writing


One of the methods to create and use offline base maps for web based GIS, JavaScript example

http://openwebgisystem.blogspot.com/2016/07/one-of-methods-to-create-and-use.html

Earthquake in Ecuador on 17 April 2016 - foreshocks, mainshock and aftershocks 

http://openwebgisystem.blogspot.com/2016/04/earthquake-in-ecuador-on-17-april-2016.html

OpenWebGIS: An open source geographic information system

https://opensource.com/life/16/3/openwebgis

Mapping information from Paleobiology and Global Biodiversity databases in OpenWebGIS

http://openwebgisystem.blogspot.com/2016/03/mapping-information-from-paleobiology.html

Customizing of OpenWebGIS interface to create your own workspace 

http://openwebgisystem.blogspot.com/2016/03/customizing-of-openwebgis-interface-to.html

Maps online with OpenStreetMap and OSMBuildings free programs topography - Aprende topografía urbana OpenStreetMap y Osmbuildings (article in Spanish)

http://ovacen.com/topografia-openstreetmap-osmbuildings

New feature of OpenWebGIS - mapping data from GBIF, and new Contributors

Thanks to our Contributors, join them, support an open source project OpenWebGIS!

http://openwebgisystem.blogspot.com/2016/03/thanks-to-our-contributors-join-them.html

OpenWebGis un open source per la visualizzazione web o mobile di sistemi informativi geografici (article in Italian)


http://openwebgisystem.blogspot.com/2016/02/developing-new-interface-design-of.html

Support OpenWebGIS crowdfunding campaign

https://openwebgisystem.blogspot.com/2016/02/3d-view-enhancements-in-openwebgis.html

Web Mapping, Part 2

http://www.xyht.com/spatial-itgis/web-mapping-part-2/

Creating WiFi map and monitoring access points based on geographic information system (OpenWebGIS) 

http://openwebgisystem.blogspot.com/2016/01/creating-wifi-map-and-monitoring-access.html

Use maps and sensors in your phone as one tool with the help of OpenWebGIS 

http://openwebgisystem.blogspot.com/2016/01/use-maps-and-sensors-in-your-phone-as.html

Mathematical operations in OpenWebGIS (on the attributes of map layers)

http://openwebgisystem.blogspot.com/2015/12/mathematical-operations-in-openwebgis.html

Web mapping (Part 1, The Basics)

http://www.xyht.com/spatial-itgis/web-mapping

Source code of OpenWeGIS for Android OS on GitHub 

http://openwebgisystem.blogspot.com/2015/11/source-code-of-openwegis-for-android-os.html

The OpenWebGIS now as Android app

http://openwebgisystem.blogspot.com/2015/11/the-openwebgis-now-as-android-app.html

Source code of OpenWeGIS on GitHub. Initial commit.


About OpenWebGIS and 3D maps at Cesiumjs.org


Mona Lisa on the map of OpenWebGIS and QGIS - Art and GIS together 


Extrude image to 2D vector, 2.5D and 3D layers on the map 

http://openwebgisystem.blogspot.com/2015/10/extrude-image-to-2d-vector-25d-and-3d.html

Spatial and temporal distribution of earthquakes in the USA and adjacent areas (1950-2015)

http://openwebgisystem.blogspot.com/2015/09/spatial-and-temporal-distribution-of_27.html

French interface of OpenWebGIS - Test version/L'interface française de OpenWebGIS - La version de test


Help to create a free online OpenWebGIS interface in your own language

http://openwebgisystem.blogspot.com/2015/08/help-to-create-free-online-openwebgis.html

Spatial and temporal distribution of earthquakes in Chile and adjacent areas (1960-2015)

http://openwebgisystem.blogspot.com/2015/09/spatial-and-temporal-distribution-of_21.html

200 million years of the dinosaurs life (sauropods) in a few seconds on the map

http://openwebgisystem.blogspot.com/2015/09/200-million-years-of-dinosaurs-life.html

3D maps, new version of Cesium JavaScript library and OpenWebGIS

http://openwebgisystem.blogspot.com/2015/09/3d-maps-new-version-of-cesium.html


Integrating your map service and Wikipedia using JavaScript and PHP

http://openwebgisystem.blogspot.com/2015/08/integrating-your-map-service-and.html

Maps, hurricanes and linear regression equation (correlation) in OpenWebGIS using JavaScript

http://openwebgisystem.blogspot.com/2015/08/maps-hurricanes-and-linear-regression.html
 
How to create a heatmap on the map using JavaScript, Openlayers and canvas

http://openwebgisystem.blogspot.com/2015/08/how-to-create-heatmap-on-map-using.html

Heatmap and Interpolation: it is easy in OpenWebGIS

http://www.digital-geography.com/heatmap-interpolation-easy-openwebgis

Layer Styling, SLD file, OpenWebGIS and QGIS


SIG Online ¡Open Source! ¡3D!
 
http://mundocartogeo.blogspot.mx/2015/08/sig-online-open-source-3d.html

Weather in OpenWebGIS

http://openwebgisystem.blogspot.com/2015/07/weather-in-openwebgis.html


Import/export of OpenStreetMap vector data using OpenWebGIS

http://openwebgisystem.blogspot.com/2015/07/importexport-of-openstreetmap-vector.html

Top 10 tallest freestanding structures on the map

http://openwebgisystem.blogspot.com/2015/06/top-10-tallest-freestanding-structures.html

Some new (June 2015) features and functions in OpenWebGIS

http://openwebgisystem.blogspot.com/2015/06/some-new-june-2015-features-and.html

Integration of OpenWebGIS with “OSM Buildings” JavaScript library

http://blog.osmbuildings.org/2015/06/integration-of-openwebgis-with-osm.html


Animation of earthquakes (including aftershocks) in Nepal on 25 April by hours

http://openwebgisystem.blogspot.com/2015/04/animation-of-earthquakes-including.html

Customizing legend of the layer with cluster strategy of OpenWebGIS

http://openwebgisystem.blogspot.com/2015/04/customizing-legend-of-layer-with.html

Embedding animated maps of OpenWebGIS in your sites or blogs.

http://openwebgis.livejournal.com/13063.html

History maps with the help of OpenWebGIS. Examples.

http://openwebgis.livejournal.com/12882.html