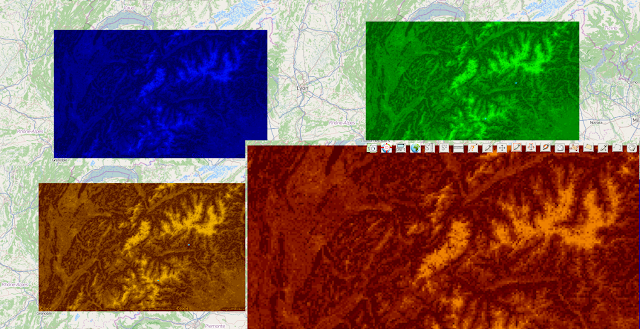
a new function has been created to manipulate images.
With the help of this function, you can calculate and get the height (height and altitude) of each pixel of your image. The calculation is performed based on the luminance (brightness) of the pixel. These estimates are used for the creation of:
- Vector layer (consisting of squares the number of which is equal or less than a number of pixels - it all depends on the settings you specify);
- Layer that consists of 2.5D columns based on "OSM Buildings" technology. For more information about "OSM Buildings" read here: "Integration of OpenWebGIS with OSM Buildings JavaScript library";
- The three-dimensional (3D) layer-based technology Cesium. For more information about "Cesium" read here:"3D maps, new version of Cesium JavaScript library and OpenWebGIS".
The brief description of the heights calculation in
"Extrude image" function:
The luminance of each pixel is calculated based on the red, green and blue components of a pixel color. In modern scientific and engineering practice the terms
Luma and
Luminance are distinguished. In OpenWebGIS in order to calculate the pixel luminance (Y), the following formula is used: Y = 0.299*R + 0.587*G + 0.114*B. If users of OpenWebGIS have a different opinion, it is possible to add in the interface the ability to calculate the luminance using other formulas, for example:
Y = 0.2126*R + 0.7152*G + 0.0722*B;
Before the calculations the users specify the height interval (in meters) that in their opinion corresponds to the height interval of objects that are on the image (relief, buildings, etc.). The calculation is performed by the formula:
H = ((Math.abs (Yi- minUserH) * (maxUserH-minUserH)) / (maxY-minY)) + minUserH;
where: Yi is the luminance value of analyzed pixel , maxUserH- maximum height defined by the user, minUserH - minimal height defined by the user, minY - minimum luminance of Image pixels, maxY- maximum luminance of Image pixels, Math.abs -return the absolute value of a number; This way calculated height is used to create a vector layer as a set of squares with the appropriate attributes, also layer of 2.5D columns the height of which is equal to calculated heights. Later the user can create 3D view of objects on the base of the vector layer.
Let's look at one of the examples of the function "Extrude image" usage.
Take a satellite photo of the Alps region of Google maps. The area covered by the image is limited by the coordinates: lower left longitude: 5.6537292421837; lower left latitude: 45.20171303181052; upper right longitude: 8.400311273051333; upper right latitude: 46.35103284714349. The photo is shown in
Figure 1.
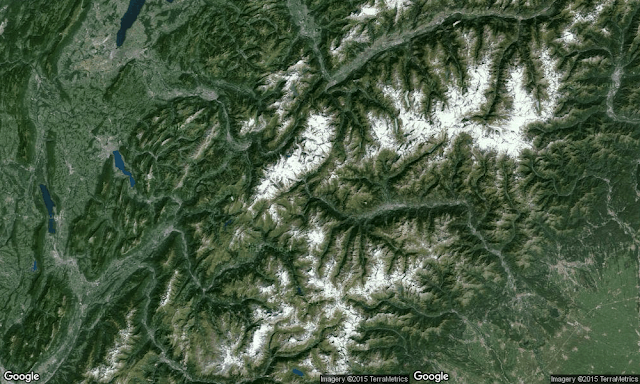 |
| Figure 1 |
Add a photo to the map by using the menu item
"Layers-> New Layer from Image file". We insert the coordinates of the image corners in pop-up window, as shown in
Figure 2.
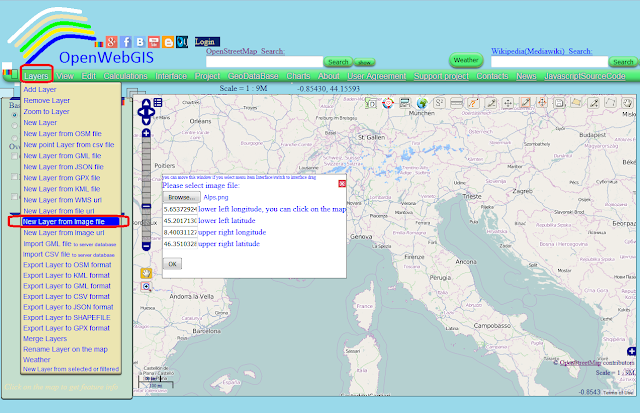 |
| Figure 2 |
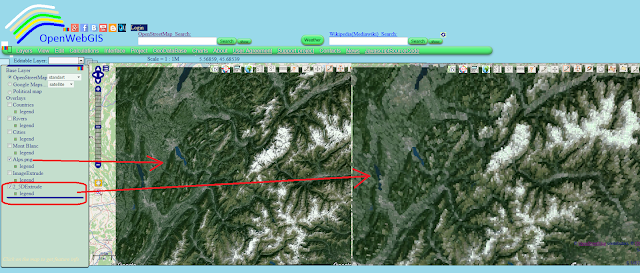
The result
of adding a satellite photo is shown in Figure 3
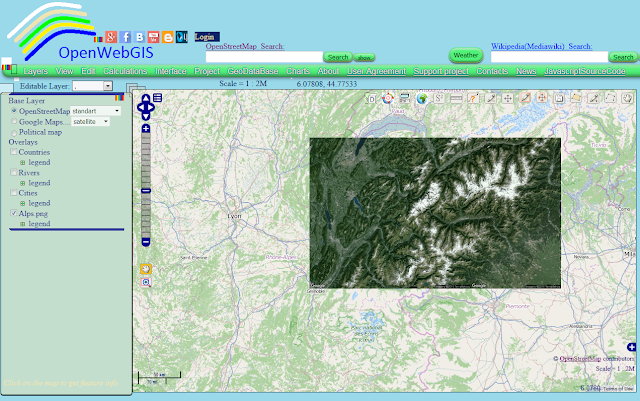 |
| Figure 3 |
The map with the added satellite photos is available
here Map 1.
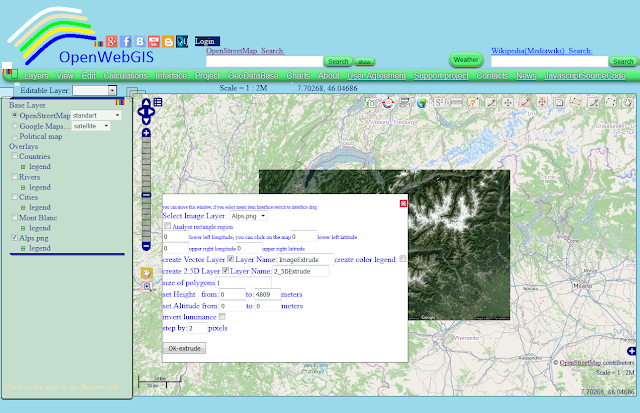
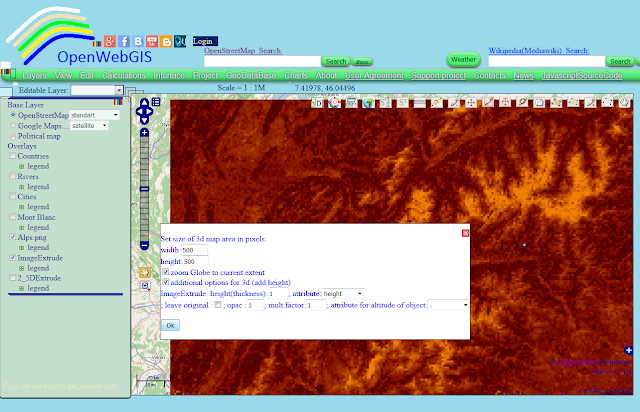
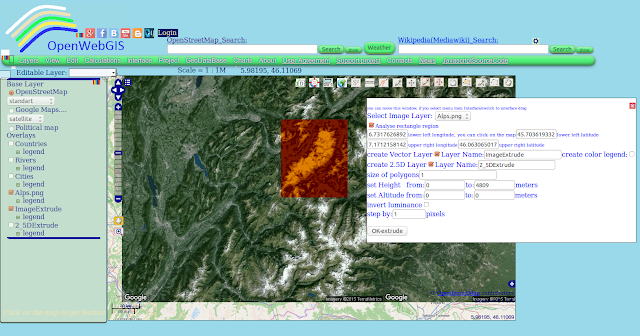
With the menu item
"Edit-> Extrude Image" open the pop-up window with options for extrusion (see
Figure 4) and set extrusion options such as shown in
Figure 5. The height is set from zero to 4809 meters (this is the height of the highest mountain in the Alps -
Mont Blanc) If you activate the option
"create color legend:" you will get the vector layer with color legend (style) which fully complies with the colors of the image, but this calculation can take a long time. Let`s perform the calculation without this option for now - click
"OK-extrude" button.
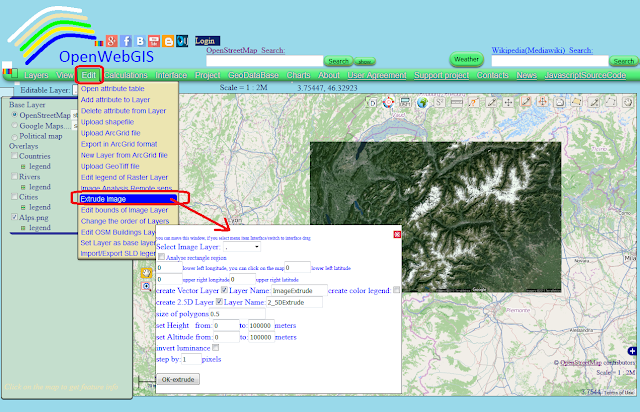 |
| Figure 4 |
 |
| Figure 5 |
It is important to understand that the larger the Image in size by pixels, the longer it will take to calculate. Also an increasing the number of pixels in the options
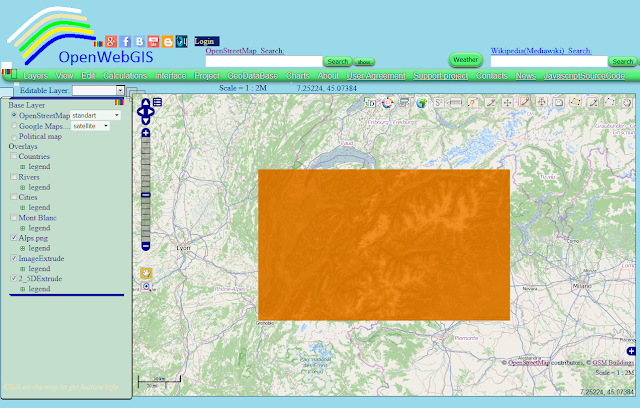
"step by: pixels" - reduces the time of calculation. The result of the calculation is shown in
Figure 6. Enlarge the map and we will make sure that the vector layer consists of a set of squares (see
Figure 7)
 |
| Figure 6 |
 |
| Figure 7 |
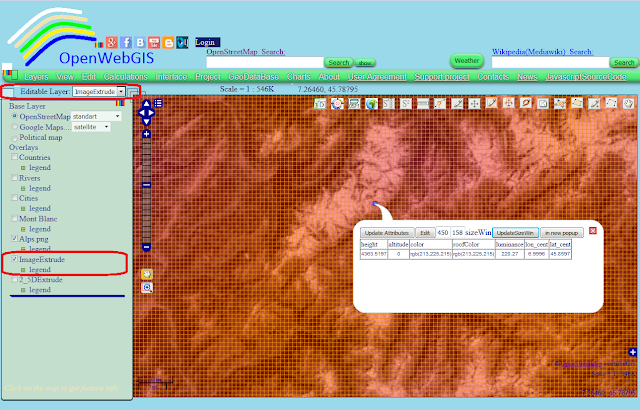
Let's see the attributes of each square. To do this, select the name of the layer
"ImageExtrude" in the
"Editable Layer" list. Then the values of all attributes of each square you can see by hovering the cursor over it and clicking on it (if while hovering over a point, it is not activated, then move the map a little bit and then again hover the cursor ). You need to click on the squre you are interested in, after that a pop-up window will be opened (See
Figure 7).
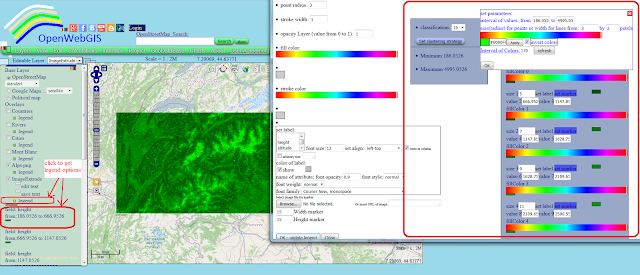
Let's change the color legend of a layer, as shown in
Figure 8. In order not to specify parameters for each height value, use the button
"Set automatically". Different variants of the layer style are shown in
Figure 9.
 |
| Figure 8 |
 |
| Figure 9 |
The map in green style with less resolution (for fast loading) that shown in Figures 8,9 is available
here: Map 2
In order to feel approximately the spatial dimension of relief (terrain), you can activate the newly created layer
"2_5DExtrude". For comparison,
Figure 10 shows a satellite image of an area and the same area depicted by a 2.5D columns that are based on the luminance of image pixels.
 |
| Figure 10 |
The map in green style with better resolution and with height layer with 2.5D columns can be downloaded here:
download Map 3 (31 MB) . Download this file and add it to the OpenWebGIS map with the help of the menu item:
"Project-> Load project file".
In order to create the 3D map you must click on the button:
in the upper right corner of the map. This button has the title
"Add 3d Map. Globe". There will be a pop-up window in which you can set the desired size of the 3D map area in pixels. Information about 3D in OpenWebGIS is available
here. Set other 3D options as shown in
Figure 11 and click
"Ok".
 |
| Figure 11 |
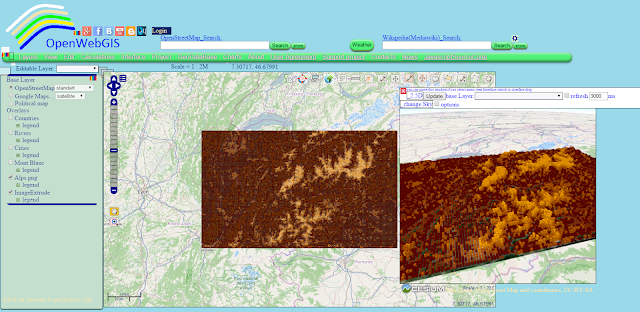
The result is shown in
Figure 12.
 |
| Figure 12 |
If you try to simulate the terrain of a smaller area, there will be more details. Let's try it. Specify options in popup window
"Extrude Image" such as shown in
Figure 13.
 |
| Figure 13 |
The result of 3D modeling of photo`s part is shown in
Figure 14.
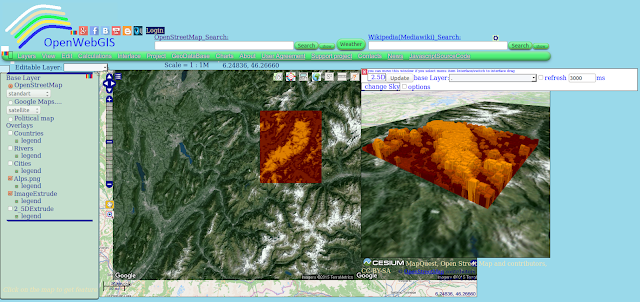 |
| Figure 14 |
The map shown in
Figure 14 with 3D view and a height layer of 2.5D columns can be downloaded here:
download Map 4 (13 MB)
Conclusion
What does the
OpenWebGIS "Extrude image" function perform? Can the results of its work be named as some variants of
Digital elevation model ? Maybe. But most likely it is just a mathematical and programmatic experiment and perhaps something similar to it has already been implemented somewhere (better or worse). Is it necessary to develop this function in OpenWebGIS and make adjustments? As users of
OpenWebGIS, please express your opinion on this matter.

 in the upper right corner of the map. This button has the title "Add 3d Map. Globe". There will be a pop-up window in which you can set the desired size of the 3D map area in pixels. Information about 3D in OpenWebGIS is available here. Set other 3D options as shown in Figure 11 and click "Ok".


No comments:
Post a Comment