1. More opportunities for setting up the interface.
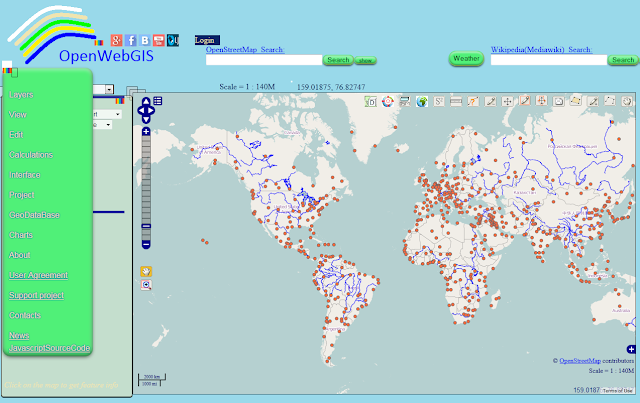
Now, the main menu can be both horizontal and vertical. To do this, click on
the appropriate button on the left on the main menu (see Figure 1 and Figure 2).
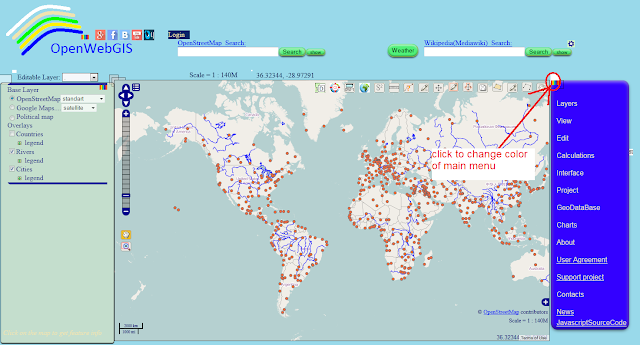
After changing the color of the main menu and moving the menu in a convenient
place for you (after you select the menu item "Interface" ->
"Switch to interface drag") your interface might look like it is
shown in Figure 3, or directly on the site of OpenWebGIS.
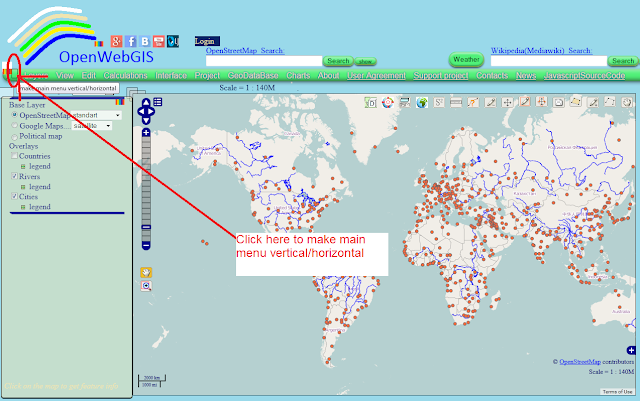 |
Figure 1
|
 |
| Figure 2 |
 |
| Figure 3 |
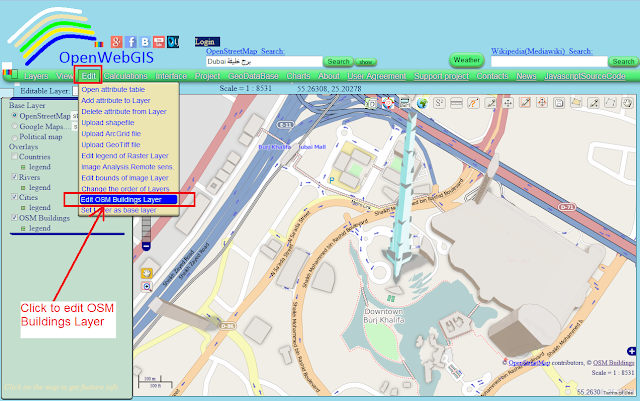
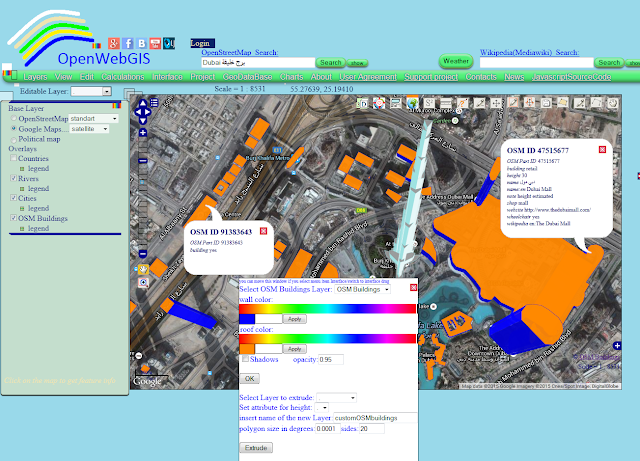
3. You can modify the layers of the "OSM
Buildings" and create 3D look like layers with a new menu item
"Edit" -> "Edit OSM Buildings Layer" (see Figure 4).
After selecting this menu item, a window will appear with the options changing
which you can change the color, transparency, and add shadows (see Figure 5) or
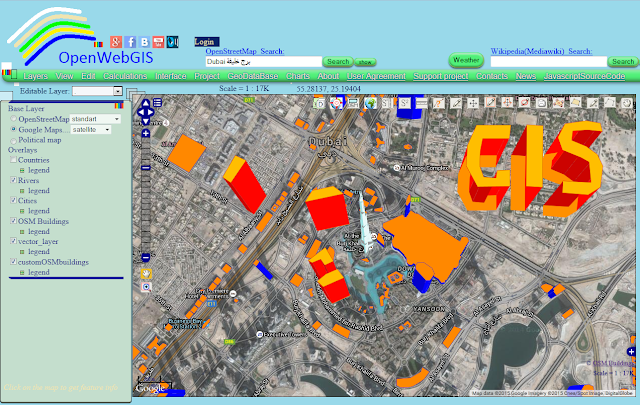
convert your flat vector layers (see
Figure 6) in the convex (like 3D). Look what is shown in Figure 6 directly on
the map 1 or map 2 of OpenWebGIS.
More information about function "Edit OSM Buildings Layer" will be given in a separate
article. The figures 4-6 show one of the highest skyscrapers Burj Khalifa. It
is a skyscraper in Dubai, United Arab Emirates. It is the tallest man-made
structure in the world, standing at 829.8 m (2,722 ft).
 |
| Figure 4 |
 |
| Figure 5 |
 |
| Figure 6 |
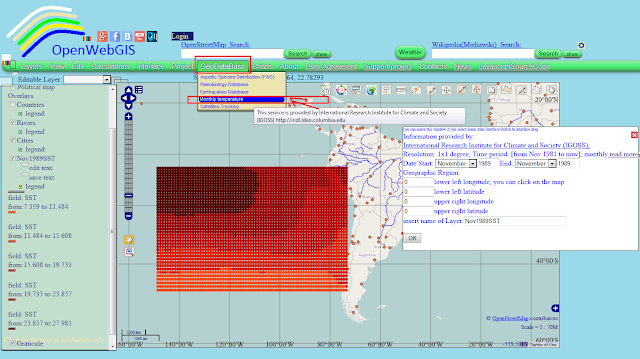
4. In the menu "GeoDataBase" the
possibility of selecting from the database
"Monthly temperature" was added. This database is created by
International Research Institute for Climate and Society (IGOSS). Data parameters: resolution: 1x1 degree; Time
period: [from Nov 1981 to now], monthly. Read more about this data: http://iridl.ldeo.columbia.edu/SOURCES/.IGOSS/.nmc/overview.html.
The result of selecting from this database is shown in Figure 7 and on the map
at this link.
The data in Figure 7 corresponds to monthly average temperature on the surface of the earth
in November 1989, with reference to the centers of degree squares. Spatial data
are limited in longitude from 73.5W to 148.5W, in latitude: 5.5S to 47.5S.
 |
| Figure 7 |
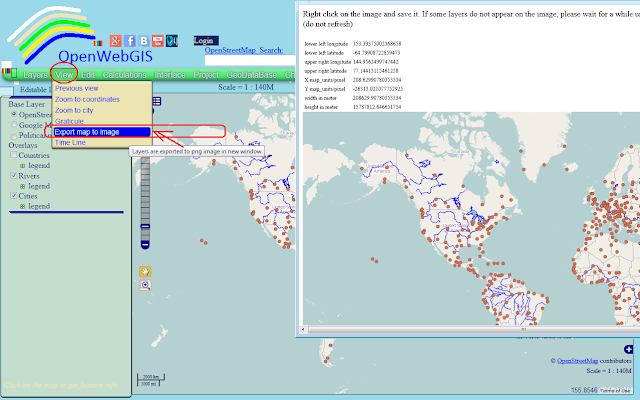
5. The function of "Export map to image"
(in the section "Edit" of the main menu) was completely redesigned,
now it is working more correctly (see Figure 8).
 |
| Figure 8 |
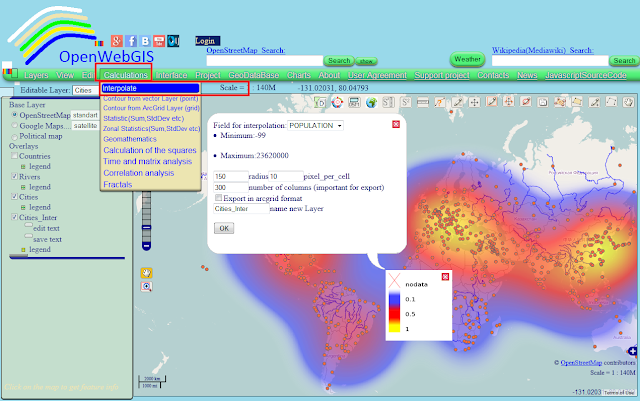
In the near
future we are planning to revise the interpolation module completely (the menu
item "Calculation-> Interpolate"). The example of
interpolation (heatmap) is shown in Figure 9.
 |
| Figure 9 |


No comments:
Post a Comment