Now the new opportunity has appeared to embed animated maps in your site or blog. Have a look at the example of such embedding on the Map 1 and in Figure 1a (source map). This article uses the maps that contain a lot of animated data, and therefore for their correct displaying the fast internet is desired. If you have a problem with the map displaying, try to refresh the page.
 |
| Figure 1a. |
Map 1-The animated map of the earthquakes all over the world with magnitude 8 and more in 1900-2014 years. For this map the time interval for each year is set - 2500 milliseconds. For further information about this map you can read here
Animated maps in OpenWebGIS are understood as maps, on which there are layers containing the attribute with the date/time values and where with the help of the "Time Line" function is started the process of layer changes drawing according to date/time changes.
Instruction on how to animate your OpenWebGIS map can be read in this article: http://openwebgis.livejournal.com/643.html or see this video:
You don`t need any longer to create a video for your readers to see your map dynamics or write the instructions about what button they need to press to start animation. After map embedding acoording to instructions given below, the map will be automatically animated with your settings. As examples in this article the maps of Atlantic Hurricane Tracks (in 1851-2004 years) and earthquakes (with magnitude 8 and more in 1900-2014 years) are shown. You can read in more detail about these maps and about data for their creation here and here.
In order to embed animated map you must:
1. Select the name of your layer (for example, "Hurricanes1851-2004") in 'Editable Layer' drop-down list, like it is shown in Figure 1. |
| Figure 1. |
2. Click on menu item "View"->"Time Line", like it is shown in Figure 2.
 |
| Figure 2. |
3. In opened popup window select the field (attribute) with date –(in our case the name of this field is "DATEYEAR"). See Figure 3. Dates/times in the field with date must be in format ISO8601:yyyy-mm-ddThh:mm:ss (for example:"1851-08-17T18:00:00"). It is necessary for
animation in OpenWebGIS.
 |
| Figure 3. |
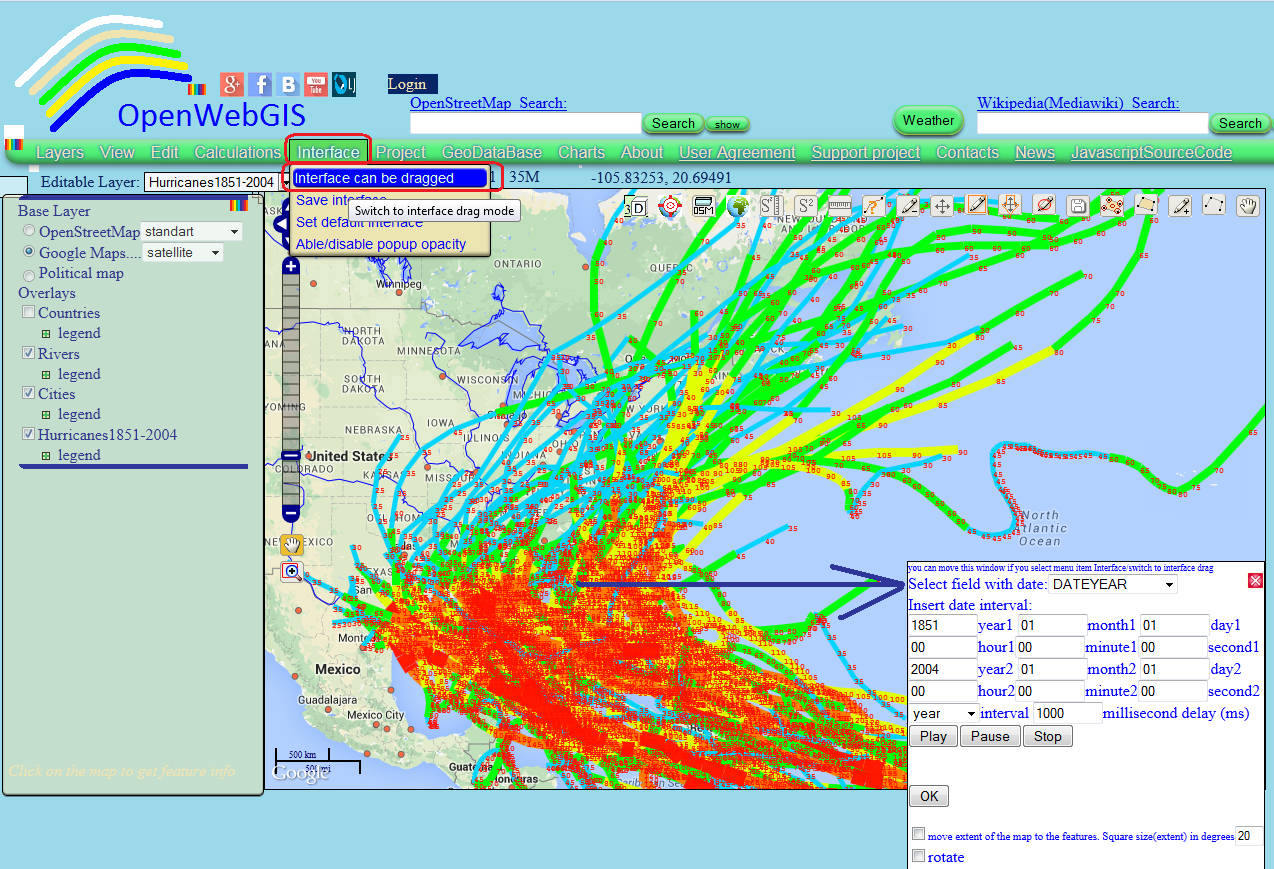
4. You can
move this window if you select menu item "Interface"->"Switch
to interface drag". Afterwards the menu item will change to: "Interface can be dragged". See Figure 4. The position of this window will be saved in a web-link or embedding code and you can remove this window from the map and users will not see it (as it looks like in Map 1) if you embed only the map in your site (without whole interface). You can leave this window anywhere on the map, so users could control animation: stop, pause and change parameters (as it looks like in Map 2).
 |
| Figure 4. |
5. Specify suitable for you parameters of animation, like it is shown in Figure 4.
6. Specify necessary legend for the layer which will be animated in our case: Next to each segment of the track the wind speed "WIND_MPH" is labeled,
7.
You can change the legend of the layer if you click on a word "legend"
under the layer name in the list on the left of the map and then click
on the drop-down list. How to do it see for example in the articles about satellite tracking in OpenWebGIS
or creating 3D track of International Space Station with the help of OpenWebGIS.
8. Not closing the window with parametrs of animation, in order to get a web-link
or an embedding code, click on the globe icon in the toolbar on the map. Read more iformation with examles here.
It is important in the appeared window to activate checkbox "save timeline" and then press "Yes" button to get a web-link with your maps or press "Yes-get code" to get an embedding code of your map. See results of emdedding code getting in Figure 5.
 |
| Figure 5. |
Select all in text area "embedding code:", copy and insert this code in your site code. The result you can see on the Map 2.
Map 2- Animation with the help of OpenWebGIS of Atlantic Hurricane Tracks 1851-2004.
On the embedded map called Map 1 the window with animation parametres is taken out of the map (see Figure 6), so in this case you can not press pause, and for example have a closer look at the earthquakes place of interest. In order to have such an opportunity while embedding the map, follow the instructions given above or directly open this map:
http://opengis.dlinkddns.com/gis/opengis_eng.html?openwebgis=Ngy0rDMwb76ZU3NRIUhgP9tV on the site of OpenWebGIS
 | |
| Figure 6. |
No comments:
Post a Comment